Usage Analysis
Users to perform wide range of tasks, from the self-service data analytics to using custom applications on top of the platform. It is important to understand how exactly they use the platform. With this knowledge you can:
- Improve UX
- Remove unused menu items, etc
- Understand your users better
- Cluster usage by usage patterns
- Correlate usage patterns with the organizational groups
- Track data history
- Track origin of datasets
- See history of modifications
- See all actions performed with an object
- Analyze performance
- See how long each operation takes
- Analyze function usage
- Get a table of users, timestamps, inputs and outputs for functions
- Track errors
- See all errors across the platform
- See which actions are causing the errors
Logs are stored in a Postgres database in a form that allows for easy
analysis of event parameters (See the following tables: events, event_types,
event_parameters, event_parameter_values). Each event is associated with a user session that triggered the event.
Client-based activity
Due to the unique technology used in Datagrok (such as in-memory database) , a significant part of the users activity happens completely on the client side, not using the server at all. This includes things like opening local files, aggregating tables, adding viewers, etc. Still, each action a user performs generates an internal named event in the platform. These events are used for multiple purposes:
- Integration between different Datagrok components
- Ad-hoc customizations and extension by plugins
- Logging
A reasonable default set of client-based actions gets logged. For instance, we log opening a file and its name, but not content. We do not log less important things like "rows selected", although there are ways to override the default behavior. This could done by writing a script using the JS API, and logging the event in the event handler. This sample demonstrates how to do it.
It's also possible to create a custom event and log it explicitly from a plugin.
To see all events generated by the client, open Tools | Dev | Inspector, and go to the "Client logs" tab. Please note
that this is an internal tool for developers.
Server-related actions
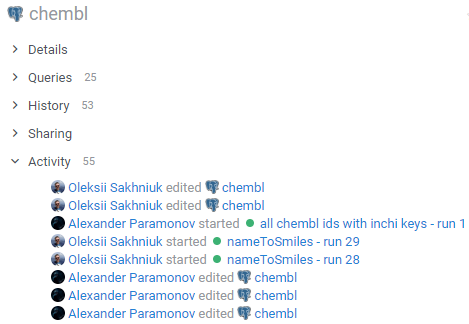
When an action does something on a server that modifies the server's state in any way, in addition to the log file it gets recorded in the audit. This is what you see under the "Activity" tab in the context panel.
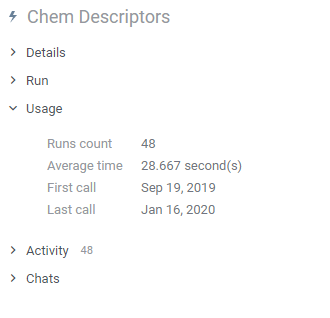
By default, each script execution gets logged, along with the parameter values. High-level overview of the usage is available under the "Usage" tag:
Usage Analysis application
Besides the above-mentioned tools, we have developed a specialized application for usage analysis. Since we are big believers in dogfooding, naturally this application is built on top of Datagrok as a public package. Moreover, it is being developed in our public git repository .
Usage Analysis app designed to provide you with comprehensive statistics and insights into the usage patterns on Datagrok platform. With Usage Analysis, you can unlock a wealth of information to better understand how users interact with platform and make data-driven decisions to enhance user experience and optimize performance. It consists of four main tabs:
1. Overview Tab: A Holistic View of Platform UsageThe Overview tab serves as the central hub for understanding the overall usage trends on platform. Through intuitive graphs, you can explore the number of unique users over time, track the distribution of users across different packages, and visualize user activity levels. This bird's-eye view of platform usage gives you a quick snapshot of how Datagrok is performing and evolving.
2. Packages Tab: Uncover User Activity by PackagesThe Packages tab delves deeper into the specifics of user activity, providing you with a scatterplot that reveals how different packages are being utilized. By analyzing the distribution of user activity across packages, you can identify which packages are most popular and which ones may require further attention.
3. Functions Tab: Explore User Interaction with Platform FunctionsUnderstanding how users engage with specific functions on our platform is crucial for refining the user experience. The Functions tab presents a dynamic scatter plot that visualizes the frequency and patterns of function usage by users. By analyzing this data, you can identify the most frequently used functions, identify areas of high or low user engagement, and tailor Datagrok's functionalities accordingly.
4. Events Tab: Delve into Platform EventsThe Events tab provides two insightful charts that offer deeper insights into platform events. The first chart showcases the sources of events, enabling you to identify where the majority of activities originate. This knowledge can help allocate resources effectively and focus on areas that drive the most engagement. The second chart showcases the events specific to individual users, allowing you to track their activity history and understand their usage patterns better.
Global Filters: Customized Data Exploration
To empower you with precise and tailored insights, Usage Analysis offers global filters. These filters allow you to narrow down the statistics based on a specific date range, user groups, or packages. By applying these filters, you can segment the data and gain granular insights that are most relevant to your analysis. This level of customization ensures that you can focus on the aspects that matter most to you.
Interactive Charts: Uncover Deeper Insights
Our interactive charts take data exploration to the next level. By simply clicking on a dot within a scatterplot or selecting a category on a bar chart, you can unlock more detailed information. The context panel dynamically displays relevant data, allowing you to gain deeper insights into user behavior and make informed decisions.
Drilldown: A Seamless Journey through Platform Analytics
Drilldown feature allow you to effortlessly explore deeper insights across different tabs. With the click of a Details button in the context panel, seamlessly transition from one tab to another, gaining more specific information about selected data points. Whether you want to dive into the functions behind package activity or investigate detailed event sources, our drilldown feature provides a fluid and intuitive analytical journey, empowering you to extract even more valuable insights.