Rich Function View
RichFunctionView is an advanced UI editor to create a complex full-featured interface for your script.
It has all the features of the basic scripting. In addition, it allows you to:
- Enhance inputs and outputs
- Review historical script runs
- Provide custom docs and export
- Use model parameters optimization capabilities with your script without a single line of the code.
- Integrate into workflows
Ensure that the Compute2 and WebComponents packages are installed
Enabling RichFunctionView UI editor
To enable RichFunctionView, add editor: Compute2:RichFunctionViewEditor tag
to your following code as it is shown:
- Result
- Python / R / Octave / Julia
- Javascript / NodeJS
#editor: Compute2:RichFunctionViewEditor
//editor: Compute2:RichFunctionViewEditor
Features of the RichFunctionView affect GUI only and do not affect computations. Use the RichFunctionView only when you are sure that the script works as expected.
Enhance inputs and outputs
Visualize input data
You can add viewers for input dataframes to review input data before starting computations, same way as for output viewers.
- Result
- Short sample
- Full sample
//input: dataframe test { viewer: Line chart | Grid }
//name: Viewer properties demo
//language: javascript
//sample: demog.csv
//input: dataframe test { viewer: Line chart | Grid }
//output: dataframe test2
//editor: Compute2:RichFunctionViewEditor
test2 = test.clone();
You can specify input viewer's properties to control their appearance.
Viewer's properties are listed in the braces right after the viewer's
name. A full list of the viewer's properties may be found by
right-clicking on it and selecting the Properties... (dev tools) menu item.
Some options could be set directly in a chart annotaion via
Grid(prop: val) syntax, however for many options a js viewer object
must be used. To obtain js properties object a Dev Tools platform
package must be installed. Right click on the chart, then To Script,
then To JavaScript. The second argument is the properties
object. For the purpose of directly using this object there is a
viewersHook annotation. It must be a js function full name. Since
viewer hook is synchronous, viewersHook function must just return
another js function, which accepts the following arguments:
- ioName:
string- name of the input or output - type:
string- viewer type - viewer:
DG.Viewer- viewer js object - meta?:
any- optional io metadata, available only in workflows.
function MyScriptViewersHookMaker() {
  return (ioName: string, type: string, viewer: DG.Viewer) => {
    viewer.setOptions(...)
  }
}
When used inside a workflow, the hook also receives a meta
argument and is re-invoked whenever metadata published by
meta links changes. See the workflow-side
viewersHook reference for the full signature.
RichFunctionView supports the dockSpawnConfig option to control the
viewer's width. By default, any viewer occupies all available
space. Inside dockSpawnConfig there must be a json map with a viewer
tab name and the following config.
interface DockSpawnConfigItem {
  'dock-spawn-dock-type'?: 'left' | 'right' | 'up' | 'down',
  'dock-spawn-dock-to'?: string,
  'dock-spawn-dock-ratio'?: number,
}
Viewer tab name is this context should match exactly (including
spaces) the viewer name rendered in the app, for example a line chart
for output named Trajectory will be Trajectory / Line chart. dock-spawn-dock-to is also using this naming convention.
- Result
- Short sample
- Full sample
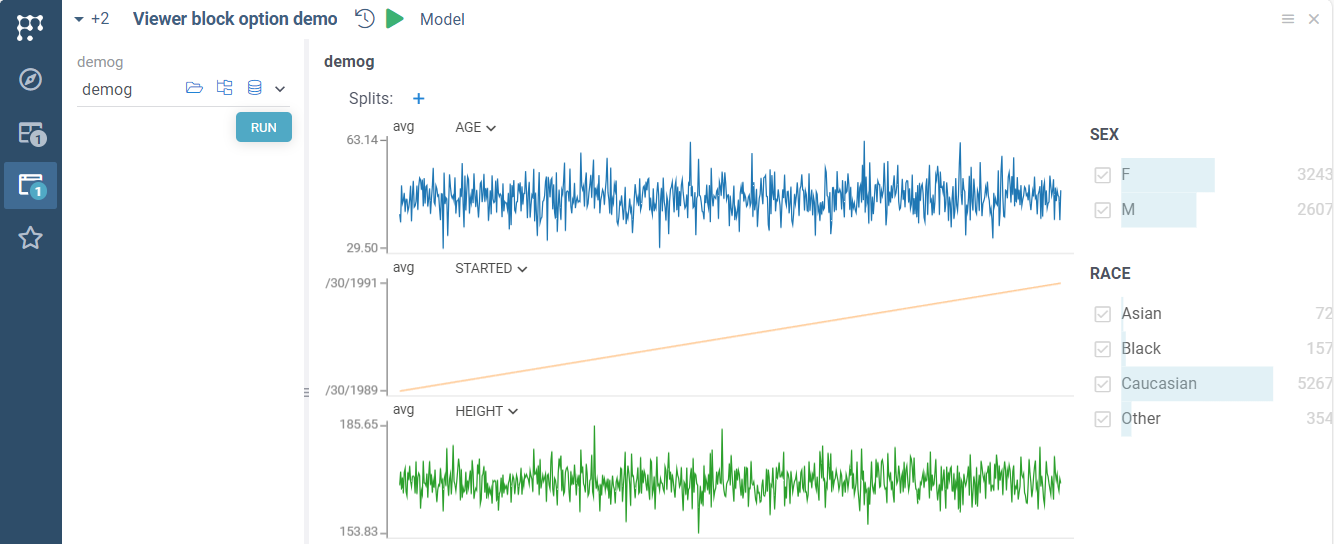
//input: dataframe demog { viewer: Line chart | Filters }
//name: Viewer block option demo
//language: javascript
//input: dataframe demog { viewer: Line chart | Filters }
//output: dataframe test2
//editor: Compute2:RichFunctionViewEditor
test2 = demog.clone();
Group scalar outputs
You can use the category keyword to group scalar output parameters.
In the case of output parameters, the category tag specifies
the output tab used to show the output parameter values.
The following code generates UI with three output tabs:
- Result
- Short sample
- Full sample
The view includes 4 tabs in total since there is a separate tab for input dataframe viewers.
//output: dataframe tempOnTime4 { viewer: Line chart }
//output: dataframe tempOnTime5 { viewer: Line chart }
//output: double IC3 { category: Tab #3}
//output: double IC4 { category: Tab #3}
//name: Grouping outputs
//language: javascript
//input: dataframe test { viewer: Line chart }
//input: double S1 = 50 { caption: S1 }
//output: dataframe tempOnTime4 { viewer: Line chart }
//output: double IC1 { category: Experimental data }
//output: dataframe tempOnTime5 { viewer: Line chart }
//output: double IC2 { category: Simulation data }
//output: double IC3 { category: Tab #3 }
//output: double IC4 { category: Tab #3 }
//editor: Compute2:RichFunctionViewEditor

tempOnTime4 = test;
tempOnTime5 = test;

IC1 = 10;
IC2 = 20;
IC3 = test.rowCount * 2;
IC4 = test.rowCount;
Automatic script rerun
You can run scripts automatically on UI opening and/or on any input change.
This feature is useful for fast prototyping. We recommend using it only
on fast Javascript scripts only to avoid repeatable runs of computational-heavy code.
The automatic function calls are not saved, so to save results to the run history you should press the Save button manually.
- Result
- Short sample
- Full sample
//meta.runOnInput: true
//name: Data stats
//language: javascript
//tags: demo
//input: dataframe inputDf {caption: Input dataframe; viewer: Grid(); category: Input data}
//output: dataframe outputDf {caption: Output dataframe; viewer: Line chart | Scatter plot | Statistics; category: Stats}
//editor: Compute2:RichFunctionViewEditor
//meta.runOnInput: true

outputDf = inputDf.clone();
Form layout and run controls
A few annotations control how the input form and the Run button are presented, without affecting computations.
Customize the Run button label
Use meta.runLabel to change the text on the Run button. The default is Run. When the
output is outdated after a previous run, the button automatically switches to Rerun regardless
of this label.
//meta.runLabel: Simulate
Render the input form as a tab
By default the input form is docked on the left side of the view. Set meta.formAsTab to true
to render it as a regular tab next to the output viewers instead.
//meta.formAsTab: true
When formAsTab is enabled, dock-type hints from dockSpawnConfig on
the inputs panel are ignored.
Workflow-oriented behavior
The annotations below take effect whenever a script is rendered through RichFunctionView, but they are designed for workflow UX — where the user navigates between many steps and wants to focus on outputs. In a standalone single-script view they still work, but the use case is unusual.
Keep the Run button always available
By default the Run button is hidden once the current run is up to date. Enable the rerun
feature flag to keep it available, so the user can always launch a fresh run with the same
inputs.
//meta.features: {"rerun": true}
Inside a workflow the flag controls the Rerun button in the step's navigation toolbar (Back / Run / Next / Update). In standalone RichFunctionView the same flag keeps the in-form Run button visible after a completed run.
Collapse the input form on open
Set meta.inputsHidden to true to start with the input form collapsed. A small chevron in the
form panel header lets the user reveal it on demand and collapse it back later.
//meta.inputsHidden: true
The form stays collapsed even when validators emit warnings or errors. This is safe because:
- A validation error blocks the Run button, so the user cannot start a run with invalid inputs unnoticed.
- In a workflow, warnings and errors also appear on the workflow navigation tree, surfacing issues even when the form is not visible.
Provide custom docs and export data
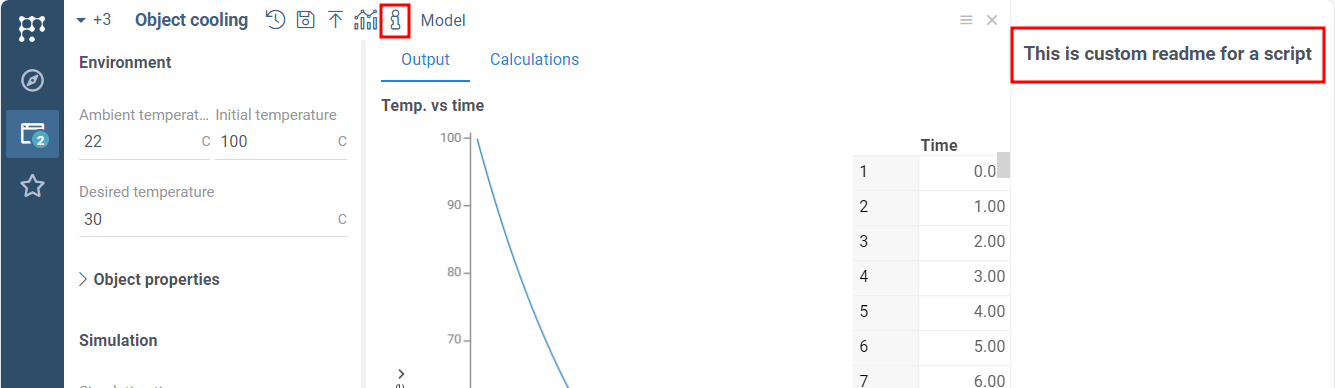
Add the readme
You can add a customized readme file to your script. The linked Markdown file will be available by clicking icon on the ribbon panel. The readme file will appear inside the panel on the right side.
- Result
- Short sample
- Full sample
Following code will search for the help file in your Datagrok's Home folder.
//meta.help: readme.md
The following code will search for the help file in the particular package (e.g., Compute).
See the details about packages in the
convert script to a package function section
//meta.help: Compute/readme.md
//name: Data stats
//language: javascript
//tags: demo
//input: dataframe inputDf {caption: Input dataframe; viewer: Grid(); category: Input data}
//output: dataframe outputDf {caption: Output dataframe; viewer: Line chart | Scatter plot | Statistics; category: Stats}
//editor: Compute2:RichFunctionViewEditor
//meta.runOnInput: true

outputDf = inputDf.clone();
Export results
You can use the one-click export feature to save the entire script run to a local file. To generate the export file, Select Export icon on the top panel. Automatic export saves all input and output values with their captions, units, and even viewers' screenshots.
This feature is available for all scripts using the RichFunctionView.
To disable it, add the meta.features tag to the script header.
- Result
- Disable export
//meta.features: {"export": false}
Customize export
You can customize export using the following annotation:
//meta.customExports: [{"name": "pdf", "function": "MyPackage:MyPDFExport"}]
The export function will receive the following arguments:
funcCall: DG.FuncCall, current call.startDownload: bool, true if the function should start a file download or just return results.isOutputOutdated: bool, true if the function output is outdated.validationState:Record<string, ValidationResult>, available only if run inside a workflows.consistencyState:Record<string, ConsistencyInfo>, available only if run inside a workflows.
Declare these as //input: parameters of the export function. The current call must be
typed funccall:
//name: MyPDFExport
//input: funccall funcCall
//input: bool startDownload
//output: object result
export function myPDFExport(funcCall, startDownload) {
  // build the report for funcCall; download it when startDownload is true
}
Workflows also support a workflow-level customExports option with a different handler
signature (it receives the whole pipeline state, not a single call). See the workflow
Custom exports reference for details.
Review and compare historical script runs
Save and access run history
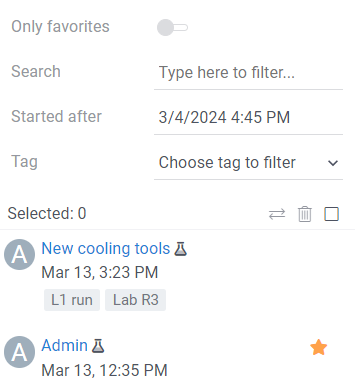
When enabled (by default), the server saves each script run. The saved script run includes both the input and output values of the run. To review the history of runs, click on the History button on the top panel.
The history panel appears on the right side. To load the run into the UI, click on the corresponding card. The historical runs are immutable. Thus, if you load a historical run, change input values, and then rerun it, the platform will create a new historical run.
To disable history, add the following line to your code:
//meta.features: {"history": false}
Highlight key parameters in history cards
By default, history cards list all inputs and outputs in declaration order. Use meta.mainParams
to pin a short list of names that should appear prominently on each card, making it easier to
distinguish runs at a glance.
//meta.mainParams: ["initTemp", "ambTemp", "timeToCool"]
Names refer to the script's //input: and //output: parameters. Other parameters are still
saved and shown in the card details.
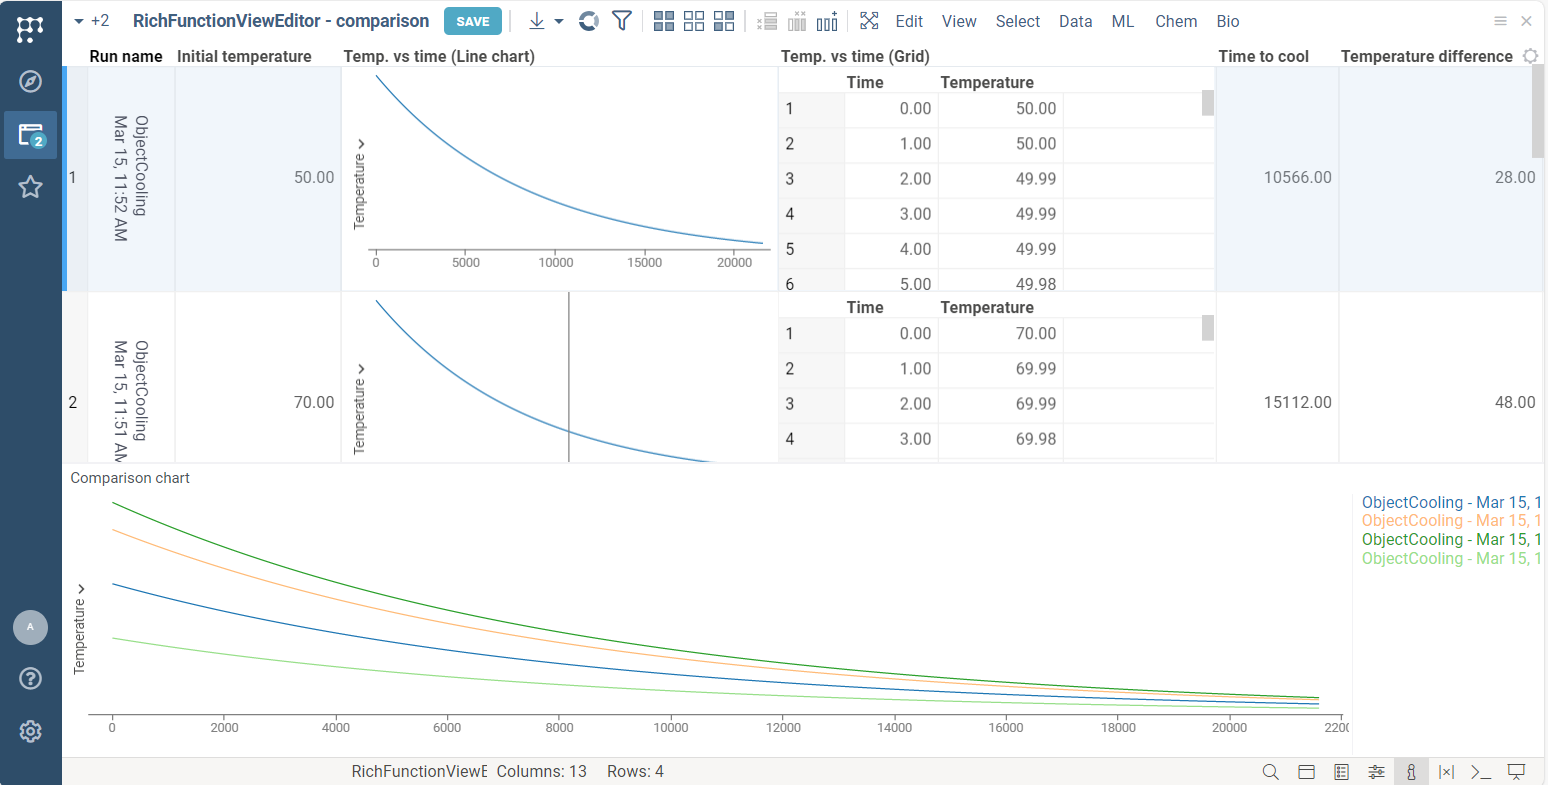
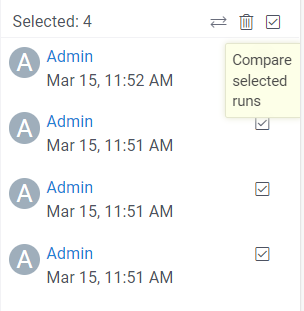
Compare historical runs
You may compare historical runs using history panel. Select the historical runs of the interest and click icon to open the comparison view.
Datagrok provides defauls set of viewers to compare all kinds of the output data.
Click on the column header with table data (e.g. Temp. vs time) to see convenient comparison chart.
- Comparison
- How to compare
Model parameters optimization
With RichFunctionView you can use the powerful built-in optimization functions.
Both Sensitivity analysis and Parameter optimization trigger
many simultaneous runs of the model. We recommend using these
features on fast Javascript and WebAssembly scripts to avoid
repeatable running of heavy server-side code.
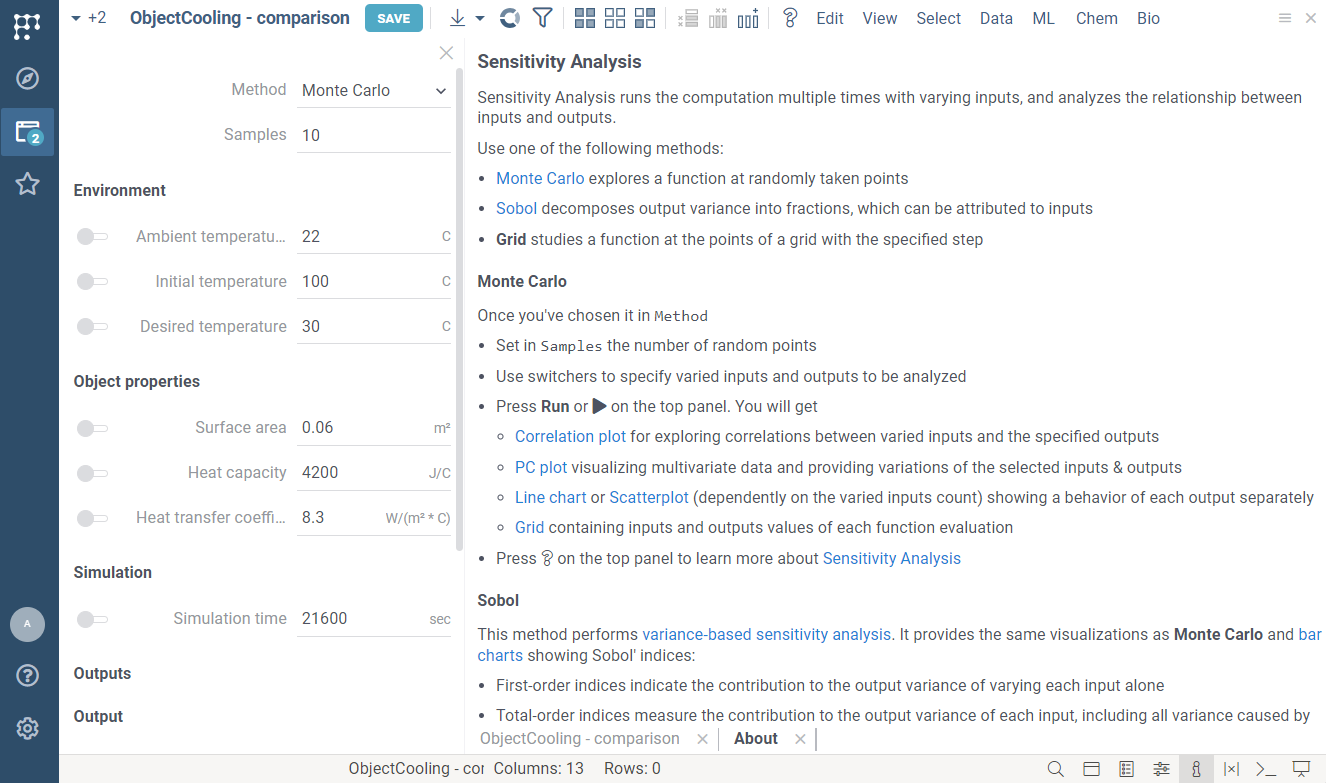
Sensitivity analysis
Sensitivity analysis automatically runs the computation multiple times with varying inputs, and analyzes the relationship between inputs and outputs.
- Result
- Short sample
- Full sample
//meta.features: {"sens-analysis": true}
//name: Object cooling
//description: Uses Newton's law of cooling to simulate object cooling process. Default values are for cube of boiling water in air.
//language: javascript
//tags: simulation, demo
//input: double ambTemp = 22 {caption: Ambient temperature; units: C; category: Environment }
//input: double initTemp = 100 {caption: Initial temperature; units: C; category: Environment }
//input: double desiredTemp = 30 {caption: Desired temperature; units: C; category: Environment }
//input: double area = 0.06 {caption: Surface area; units: m²; category: Object properties}
//input: double heatCap = 4200 {caption: Heat capacity; units: J/C; category: Object properties }
//input: double heatTransferCoeff = 8.3 {caption: Heat transfer coefficient; units: W/(m² * C); category: Object properties}
//input: int simTime = 21600 {caption: Simulation time; units: sec; category: Simulation }
//output: dataframe simulation {caption: Temp. vs time; category: Output; viewer: Line chart | Grid}
//output: double timeToCool {caption: Time to cool; units: sec.; category: Output}
//output: double coolingFactor {caption: Cooling factor; units: 1 / sec.; category: Calculations}
//output: double tempDiff {caption: Temperature difference; units: C; category: Calculations}
//editor: Compute2:RichFunctionViewEditor
//meta.features: {"sens-analysis": true}

timeToCool = undefined;

const tempDiff = initTemp - ambTemp;
const coolingFactor = heatTransferCoeff * area / heatCap;

const timeStamps = new Float32Array(simTime).map((_, idx) => idx);
const simulatedTemp = timeStamps.map((timeStamp) => {
  const currentTemp = ambTemp + (tempDiff * (Math.E ** -(coolingFactor * timeStamp)));

  if (!timeToCool && currentTemp < desiredTemp) {
    timeToCool = timeStamp;
  }

  return currentTemp;
});

simulation = DG.DataFrame.fromColumns([
  DG.Column.fromFloat32Array('Time', timeStamps),
  DG.Column.fromFloat32Array('Temperature', simulatedTemp),
]);
Parameters optimization
The parameters optimization solves an inverse problem to the sensitivity analysis: finding the input conditions that lead to a specified output of the model. It computes inputs minimizing deviation measured by loss function.
To enable parameters optimization, set the fitting feature flag:
//meta.features: {"fitting": true}
Tuning fitting defaults
You can override the parameter-fitting view's default settings with meta.fittingSettings. The
value is a JSON object that is merged with the platform defaults at startup; anything you do not
set keeps its default. The schema is defined alongside the optimizer in
libraries/compute-utils/function-views/src/fitting/optimizer-api.ts.
//meta.fittingSettings: {"method": "Nelder-Mead", "maxIterations": 200}