Tutorial and examples
This tutorial demonstrates how to create a multi-step analysis using low-code workflows. We'll use the standard Wine Quality dataset as an example.
Our workflow will perform the following tasks:
- Load the public dataset,
- Perform two separate calculations:
- Regression to predict wine quality.
- Clustering wines based on chemical profile.
- Combine: Highlight which clusters have best average quality.
You can find the complete code for this package in the GitHub repository.
Development setup and minimal workflow
Setup a dev environment as described here.
To create a package for workflow, run the following commands:
grok create winequalitywf
cd winequalitywf
npm i @datagrok-libraries/compute-api
Dependencies
Go to the package.json file and change the dependencies section:
"dependencies": {
    "@datagrok-libraries/compute-api": "^0.6.3",
    "@datagrok-libraries/utils": "^4.4.0",
    "cash-dom": "^8.1.4",
    "datagrok-api": "^1.21.3",
    "dayjs": "=1.11.10"
  },
Run npm to update
Minimal workflow script
Place the following code to the src/package.ts file:
/* Do not change these import lines to match external modules in webpack configuration */
import * as grok from 'datagrok-api/grok';
import * as ui from 'datagrok-api/ui';
import * as DG from 'datagrok-api/dg';
import type { PipelineConfiguration } from '@datagrok-libraries/compute-api';
import dayjs from 'dayjs';
import utc from 'dayjs/plugin/utc';
import timezone from 'dayjs/plugin/timezone';

dayjs.extend(utc);
dayjs.extend(timezone);

export const _package = new DG.Package();

//meta.role: model
//editor: Compute2:TreeWizardEditor
//input: object params
//output: object result
export async function WineQualityWf(params: any) {
  const c: PipelineConfiguration = {
    id: 'winequalitywf',
    nqName: 'winequalitywf:WineQualityWf',
    version: '1.0',
    type: 'static',
    steps: [{
      id: 'step1',
      nqName: 'winequalitywf:MyAddScript',
    }]
  };
  return c;
}

//input: double a
//input: double b
//output: double c
export function MyAddScript(a: number, b: number) {
  return a + b;
}
The imports of utc, timezone and daysjs are required for the TreeWizardEditor to work.
In the main part of the script, we define the WineQualityWf function that creates and returns
a JSON object with the PipelineConfiguration type that defines our workflow.
The nqName: key of the configuration should always contain the name of the main function and main script.
In our case this is winequalitywf:WineQualityWf
The steps array defines steps of our workflow.
For now, this is a mock step that adds two numbers.
The nqName: 'winequalitywf:MyAddScript' key maps the workflow step 1
to the custom function MyAddScript.
After run the following from the package root directory (change local to the actual Datagrok instance if needed).
npm i && npm run build && grok publish local --release
Note that publish --release flag is mandatory for workflow.
Reload Datagrok page, open the ModelHub in the Apps->Compute sections,
and run the MyWorkflow model.
You will see the following interface:
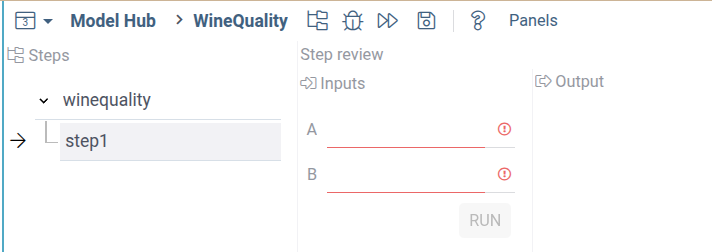
Using scripts for workflow steps
Let's enhance our workflow by adding computation logic. Since Datagrok supports multiple programming languages, we can implement computational logic using any supported language. For this example, we'll use Python as the most popular language for data science.
Make the folder scripts inside your package and add
the file fetchwinedata.py with the following code:
#name: fetchwinedata
#description: Fetch Wine quality dataset from web
#language: python
#input: string url_red = "https://archive.ics.uci.edu/ml/machine-learning-databases/wine-quality/winequality-red.csv"
#input: string url_white = "https://archive.ics.uci.edu/ml/machine-learning-databases/wine-quality/winequality-white.csv"
#output: dataframe df_wine
#output: int total_lines

# Load datasets
df_red = pd.read_csv(url_red, sep=';')
df_white = pd.read_csv(url_white, sep=';')

# Add a column to distinguish wine types
df_red["wine_type"] = "red"
df_white["wine_type"] = "white"

# Combine both datasets
df_wine = pd.concat([df_red, df_white], ignore_index=True)
df_wine.reset_index(drop=True, inplace=True)
total_lines = df_wine.shape[0]
Change the step function in the main package.ts file:
  const c: PipelineConfiguration = {
    id: 'winequalitywf',
    nqName: 'winequalitywf:WineQualityWf',
    version: '1.0',
    type: 'static',
    steps: [{
      id: 'fetchdata',
          friendlyName: 'Fetch data',
          nqName: 'winequalitywf:fetchwinedata',
    }]
  };
Compile and publish the package:
npm i && npm run build && grok publish local --release
Open the workflow and run it. You will see the following:
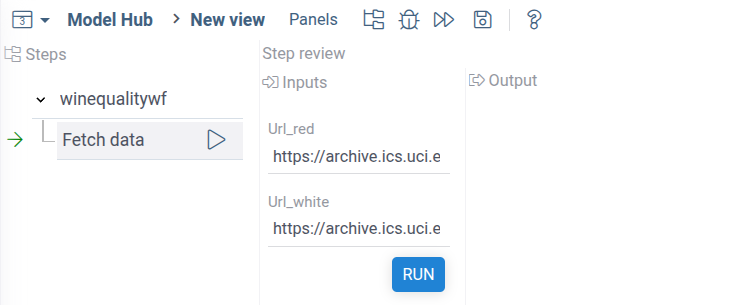
Datagrok recognized declared inputs in the Python script and automatically created UI for it.
Connecting steps
Now, let's add a step that performs some calculations with the fetched data. For example, try to cluster different wine data based on the wine characteristics.
Add to the scripts the second file clusterwinedata.py with the following content:
#name: clusterwinedata
#description: Cluster fetched data
#language: python
#input: dataframe df_wine
#input: int n_pca = 8 { caption: PCA components } [Number of PCA components to cluster]
#input: int n_clusters = 4 {caption: Clusters} [Number of clusters for K-means]
#output: dataframe df_clustering { viewer: scatterPlot(x:"PCA1", y:"PCA2", color:"cluster")}

import pandas as pd
from sklearn.preprocessing import StandardScaler
from sklearn.decomposition import PCA
from sklearn.cluster import KMeans

# --- Step 1: Preprocessing ---
features = df_wine.drop(labels=["quality", "wine_type"], axis=1)
scaler = StandardScaler()
X_scaled = scaler.fit_transform(features)

# --- Step 2: PCA for visualization ---
pca = PCA(n_components=n_pca)
X_pca = pca.fit_transform(X_scaled)

# --- Step 3: K-means clustering ---
kmeans = KMeans(n_clusters=n_clusters, random_state=42)
clusters = kmeans.fit_predict(X_scaled).astype(str)

# --- Step 4: Plotting ---
df_clustering = pd.DataFrame({
    "PCA1": X_pca[:, 0],
    "PCA2": X_pca[:, 1],
    "cluster": clusters,
    "wine_type": df_wine["wine_type"]
}, index=df_wine.index)
This script runs PCA and then simple k-means clustering on the all wine characteristics, excluding quality and type.
Now, we need to add the clustering step to the workflow.
Add the data clustering step to the workflow configuration
steps: [
        {
          id: 'fetchdata',
          friendlyName: 'Fetch data',
          nqName: 'winequalitywf:fetchwinedata',
        },
        {
          id: 'clusterwinedata',
          friendlyName: 'Clustering',
          nqName: 'winequalitywf:clusterwinedata',
        }
]
After the steps section add the links list,
describing the data link between steps:
links: [
      {
        id: 'winedatatoclustering',
        type: 'data',
        from: [
          'value_in:fetchdata/df_wine',
        ],
        to: [
          'value_out:clusterwinedata/df_wine',
        ],
      }
]
The id field is a user-specified name of the link.
The fields from and to contain descriptions of inputs and outputs of steps
that the link can use.
For now, we're using a simple notation defining a static link between two steps.
Each entry in from and to has the form <queryName>:<stepId>/<ioName>:
<queryName>is the name the link handler uses to address this port (value_inandvalue_outhere — pick anything that reads well).<stepId>matches theidof a step declared insteps.<ioName>matches a script input or output name (df_wine, etc.).
The <stepId> refers to the id you assigned in the workflow configuration, not
the script's nqName. This lets the same script appear as multiple steps with
different input bindings.
Inputs and outputs are described using the Link Query Language. The links system of the low-code workflow is very flexible and allows dynamic matching of step inputs and outputs for dynamically added steps, and even between different workflows. For the full grammar see the LQL reference; for the catalog of link types and what each controller method does, see Link types.
Publish the package:
npm i && npm run build && grok publish local --release
Open the workflow package in Datagrok and run the first step. On the second step you'll see the following:
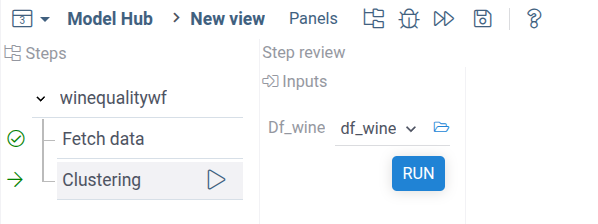
As you can see, the fetched dataframe with wine data was automatically fed into the step input.
Adding output visualization
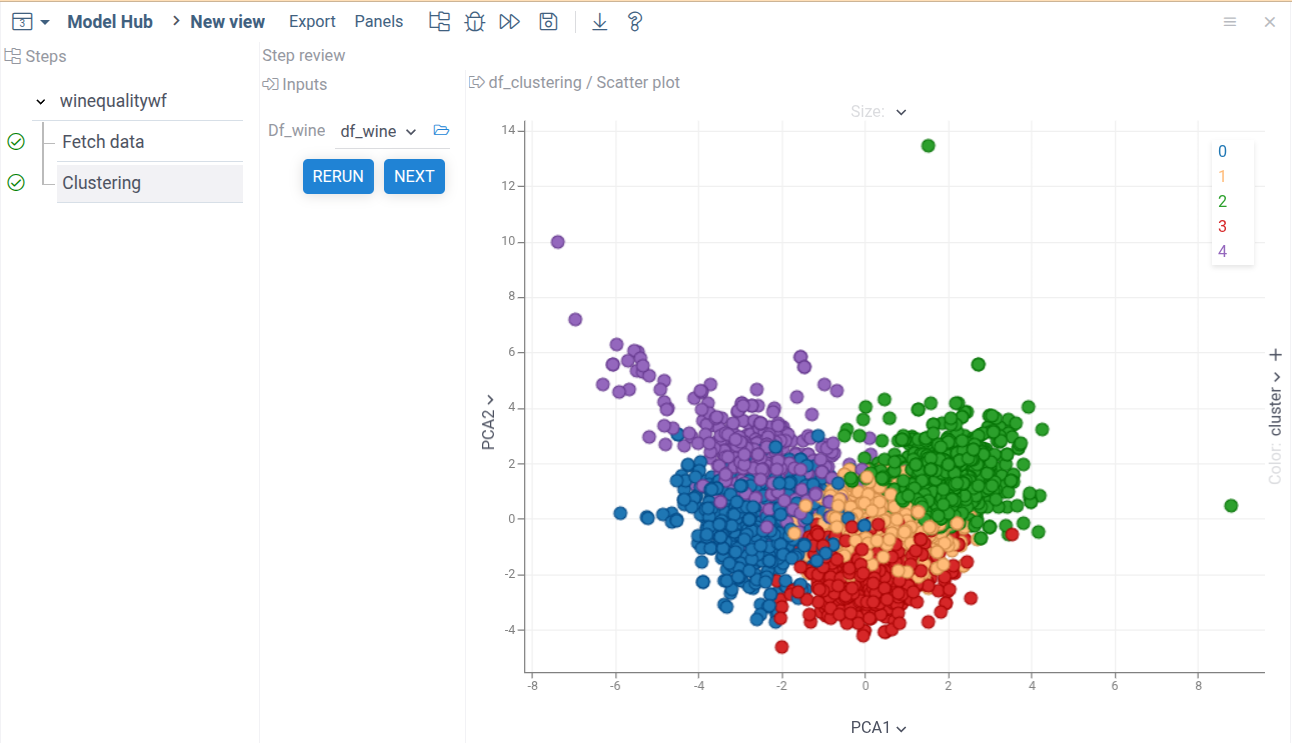
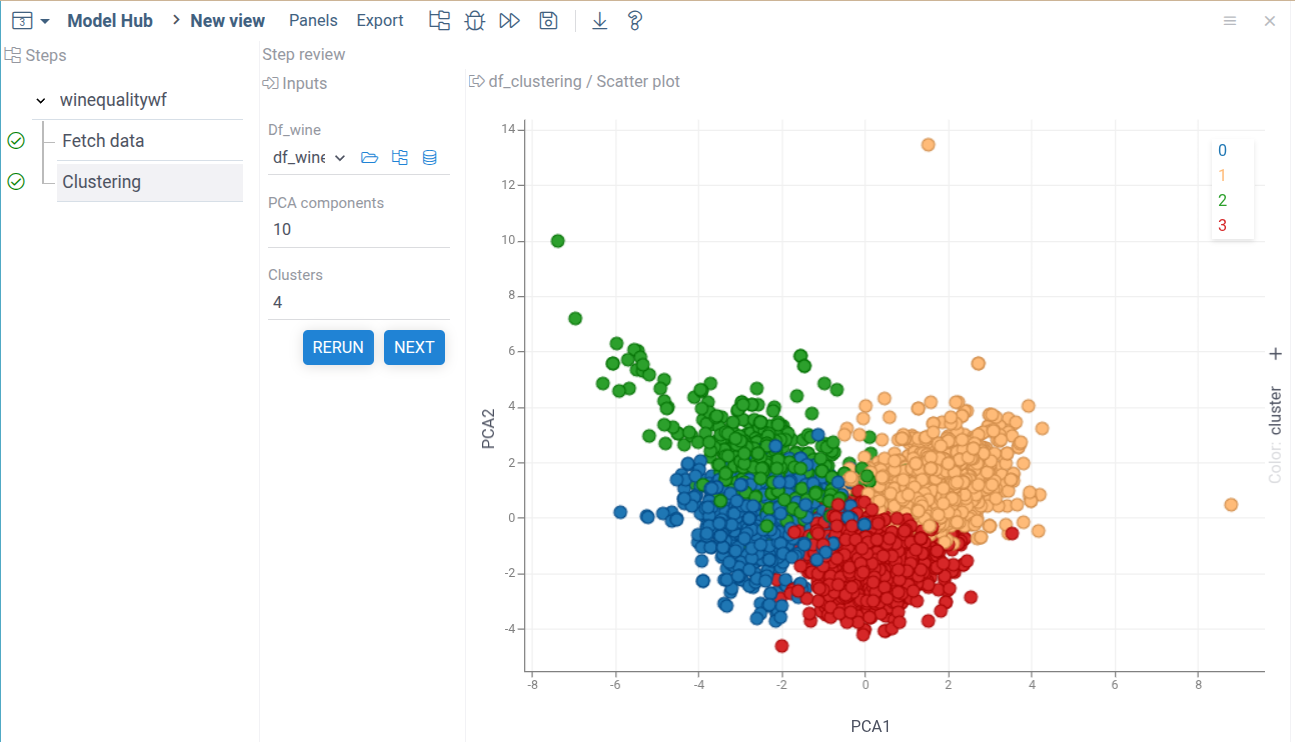
Let's improve the clustering step input and output. First, we can add a visualization to the output data. The best way to do this is to use Datagrok Scatterplot -- a high-performance and customizable scatterplot viewer. To do it, modify the output declaration of the clustering script:
#output: dataframe df_clustering { viewer: scatterPlot(x:"PCA1", y:"PCA2", color:"cluster")}
Here we specified dataframe columns for x, y, and color. You can here use all scatterplot properties. To learn more about output viewers, visit the Visualize output data section
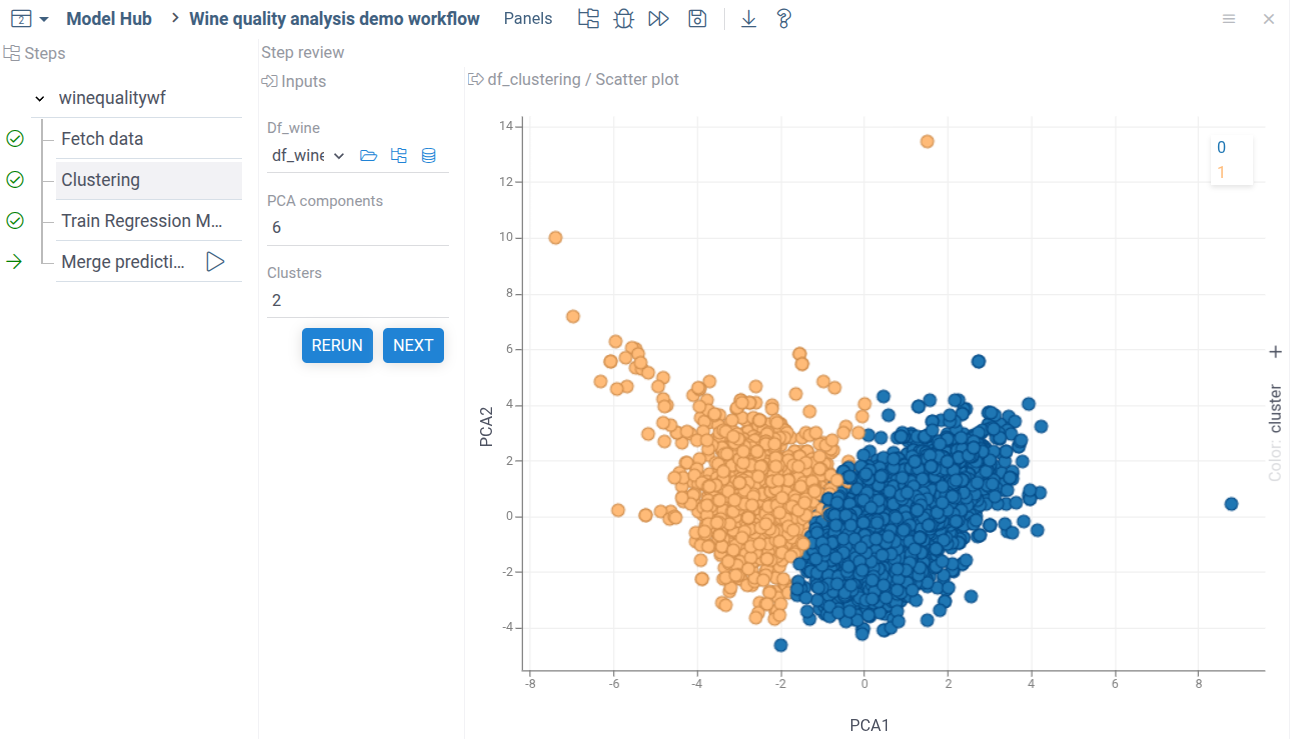
Publish and run the workflow. You'll get the following:
Adding input parameters
To make the clustering step configurable, let's add number of clusters and PCA components to the script inputs.
Add parameters to the input declaration:
#input: int n_pca = 6 { caption: PCA components } [Number of PCA components to cluster]
#input: int n_clusters = 2 {caption: Clusters} [Number of clusters for K-means]
And modify the PCA and clustering code like this:
pca = PCA(n_components=n_pca)
...
kmeans = KMeans(n_clusters=n_clusters, random_state=42)
Now you can change the number of clusters and PCA components.
Adding the regression step
Now, let's add one more step to our workflow. Now we want to create a regression model to predict wine quality based on the numeric data.
Add the file trainregression.py to the scripts folder:
#name: trainregression
#description: Train regression on wine quality data
#language: python
#input: dataframe df_wine
#input: double test_size = 0.2 {caption: Fraction of test data; min:0.1; max:0.5 }
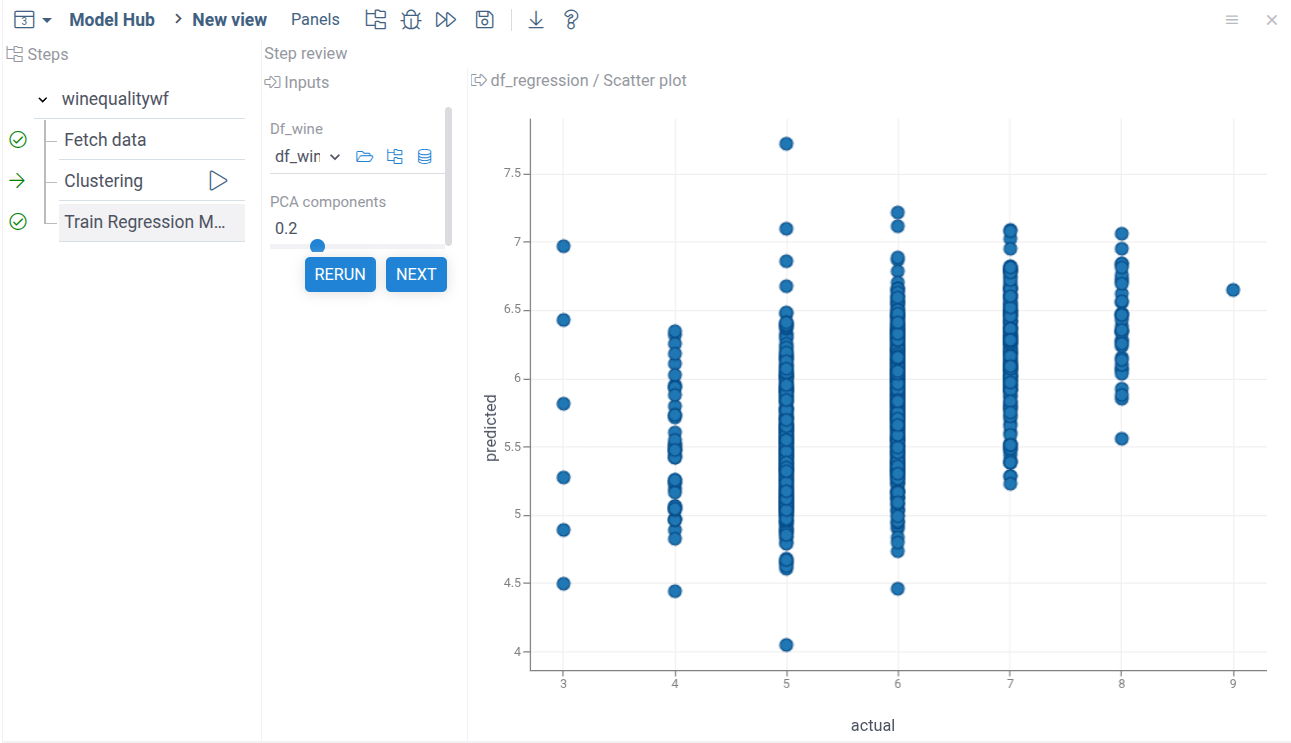
#output: dataframe df_regression { viewer: scatterPlot(x:"actual", y:"predicted")}
import pandas as pd
from sklearn.model_selection import train_test_split
from sklearn.linear_model import LinearRegression
from sklearn.metrics import mean_squared_error, r2_score
# --- Prepare features and target ---
X = df_wine.drop(columns=["quality", "wine_type"]) # features
y = df_wine["quality"] # target
# --- Train/test split ---
X_train, X_test, y_train, y_test = train_test_split(X, y, test_size=0.2, random_state=42)
# --- Train model ---
model = LinearRegression()
model.fit(X_train, y_train)
# --- Predict and evaluate on the test data ---
y_pred = model.predict(X_test)
mse = mean_squared_error(y_test, y_pred)
r2 = r2_score(y_test, y_pred)
print(f"R2 score: {r2:.2f}")
# --- Make dataframe actual vs predicted for full-zise data ---
df_regression = pd.DataFrame({
'actual': y,
'predicted': model.predict(X),
}, index=df_wine.index)
Add to the package.ts the new step:
steps: [
        ...
        {
          id: 'clusterwinedata',
          friendlyName: 'Clustering',
          nqName: 'winequalitywf:clusterwinedata',
        },
        {
          id: 'trainregression',
          friendlyName: 'Train Regression Model',
          nqName: 'winequalitywf:trainregression',
        }
]
Add the new connection:
links: [
      ...
      {
        id: 'winedatatoregression',
        type: 'data',
        from: [
          'value_in:fetchdata/df_wine',
        ],
        to: [
          'value_out:trainregression/df_wine',
        ],
      }
]
Publish the package and run the model. Now you can see the regression step in the workflow. Both computational steps use data from the data fetch step.
Combining outputs
The final step is to combine clustering and regression data in one step.
To do this, first create a simple Python script for the data combining logic. The script receives two dataframes and returns one combined dataframe containing regression data and cluster ID from the clustering dataframe.
#name: mergepredictions
#description: Merge linear regression and clustering data
#language: python
#input: dataframe df_clustering
#input: dataframe df_regression
#output: dataframe df_combined { viewer: scatterPlot(x:"actual", y:"predicted", color:"cluster")}

import pandas as pd

df_combined = df_regression.copy()
df_combined["cluster"] = df_clustering["cluster"]
Next, add to the steps the description of the new step,
and two static links to the links section:
const c: PipelineConfiguration = {
    steps: [
        ...
        {
          id: 'mergepredictions',
          friendlyName: 'Merge predictions of two models',
          nqName: 'winequalitywf:mergepredictions',
        }
        ], // we need a comma here because the `links` section follows
    links: [
      ...
      {
        id: 'regressindatatomerge',
        type: 'data',
        from: [
          'value_in:trainregression/df_regression',
        ],
        to: [
          'value_out:mergepredictions/df_regression',
        ],
      },
      {
        id: 'clusteringtomerge',
        type: 'data',
        from: [
          'value_in:clusterwinedata/df_clustering',
        ],
        to: [
          'value_out:mergepredictions/df_clustering',
        ],
      }
     ]
}
Publish and run the model.
npm i && npm run build && grok publish local --release
You'll see the following workflow tree:
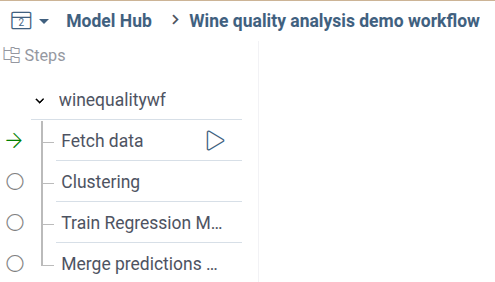
When you fetch the wine quality dataset, both analysis steps will be automatically marked by green arrows, as ready for execution:
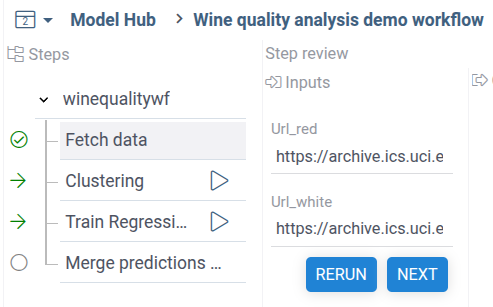
After you run both analysis steps,
the final dat merge step will be marked as ready for execution.
Run it to see the final results.
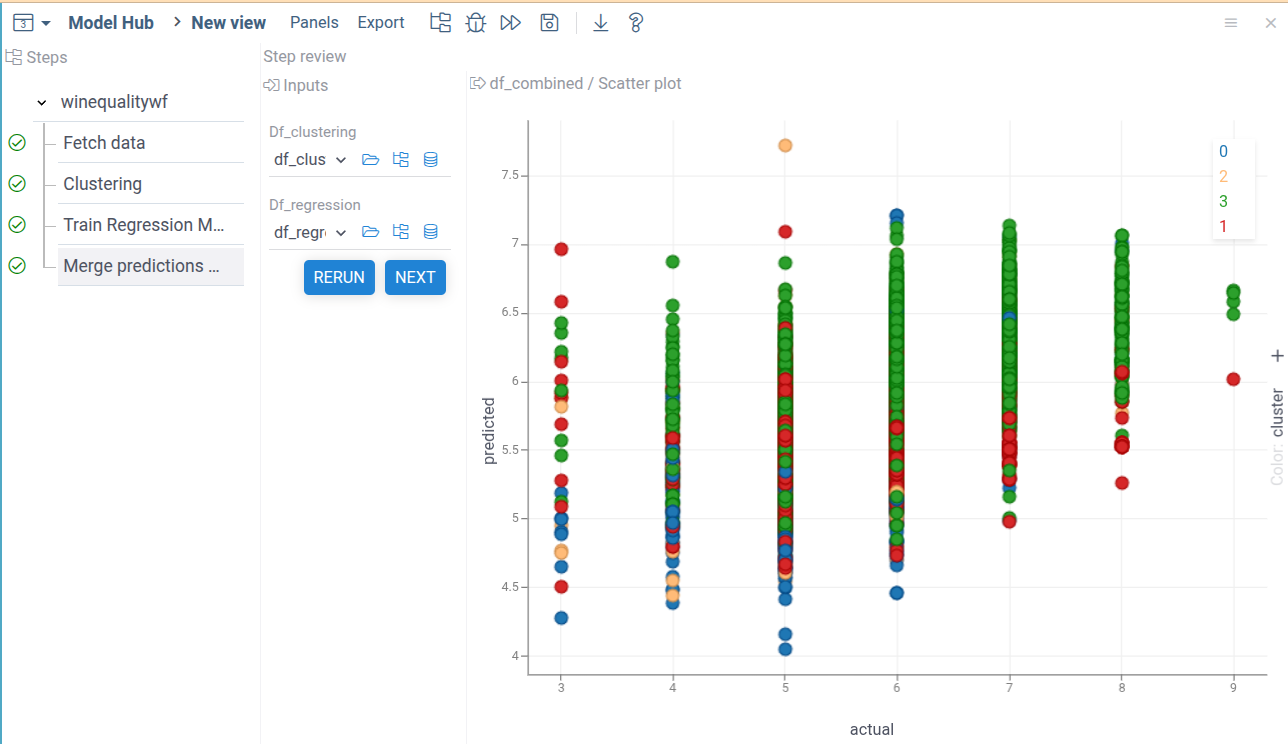
As demonstrated by the results, our prediction model's quality is not good. There's only a slight correlation between predicted and actual wine quality values. The clustering analysis, shown by colors, reveals no clear separation between classes.
However, the provided examples demonstrate the key capabilities of the Datagrok Low-code workflows. Simple JavaScript code allows you to assemble your scripts into workflow building blocks, combining the flexibility of Python/R with the automated UI construction and blaze-fast interactive viewers.
Automatic data consistency check
The Datagrok workflow engine also applies an extended set of validations, ensuring reproducibility of your workflow. For example, try to run the data merging step, then change number of clusters and rerun the clustering step.
As you can see, now we have only three clusters, and the final data merging step was immediately marked by a red circle.
The workflow engine found input data inconsistency and notified us. Now the data merge step shows the Rerun with consistent button, suggesting to rerun the step.
The Low-code workflow engine combines flexible data analysis capabilities with robust workflow state management to ensure reproducible results. Its advanced tools help maintain data consistency throughout the analysis process.
More worked examples
The walkthrough above covers a static workflow with plain data links. For
runnable TypeScript examples of the patterns that this tutorial does not
cover, see the example files bundled with the create-workflow agent skill:
| File | Demonstrates |
|---|---|
minimal-static.ts | A static workflow with no links — the smallest configuration that works. |
dynamic-with-links.ts | A dynamic workflow with stepTypes, initialSteps, an all() selector, and a link handler that propagates outputs to every downstream instance. |
validators-and-meta.ts | Cross-field validators, meta links that hide/show advanced inputs, and a user-triggered reset action. |
Each file is a self-contained provider function you can adapt to a real
workflow. They reference the same types described in this documentation
(resolvable via @datagrok-libraries/compute-api).