Test Manager Tour
Overview
The Test Manager is a powerful tool designed to assist in test reproduction, debugging, and profiling. It enables you to execute any package test efficiently.
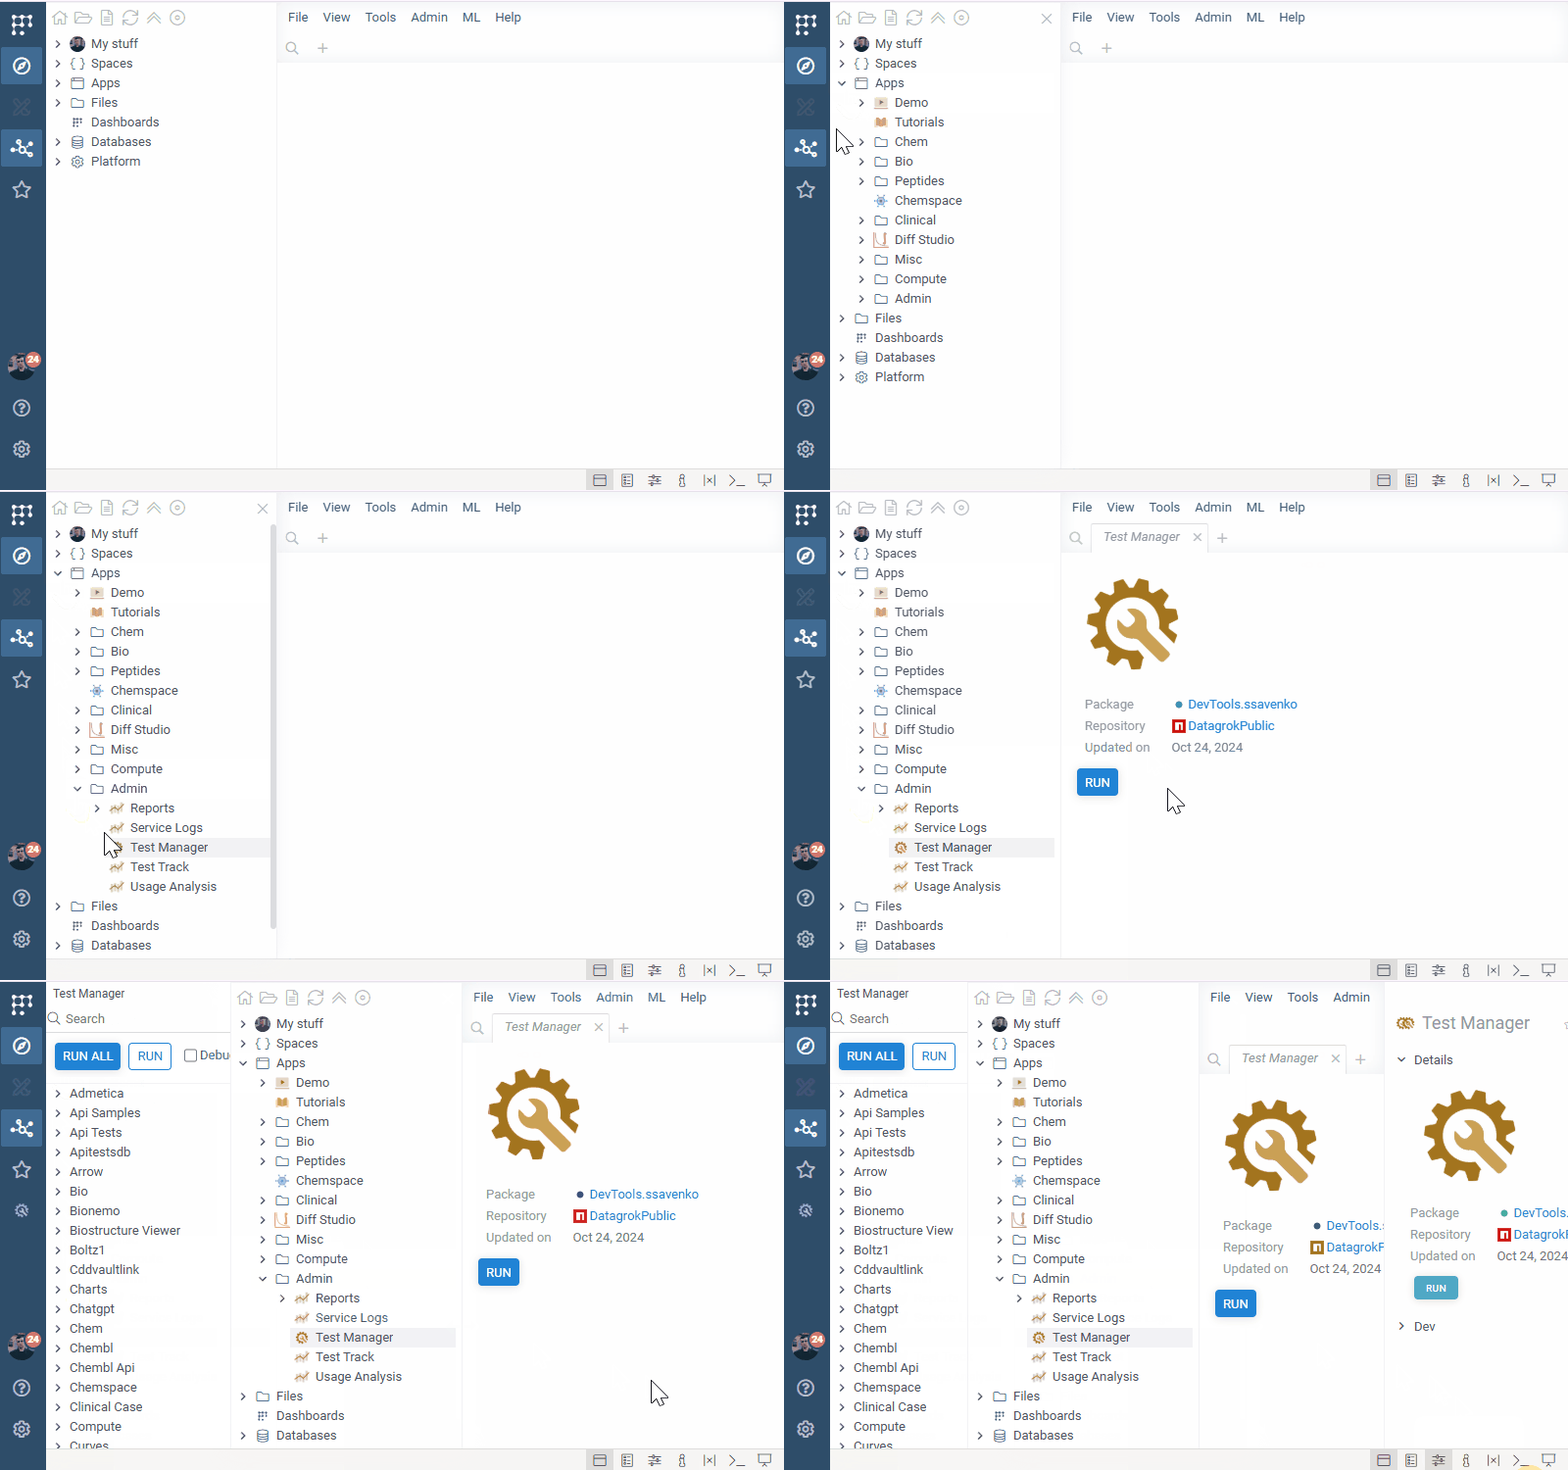
To access Test Manager, navigate through the following path in the Browser:
Apps > Admin > Test Manager

Test Manager Options
Test Manager options:
| Option | Description |
|---|---|
| Debug | Enables debug point before Test execution (Useless without Browser Inspector (F12)) |
| Benchmark | Runs test in Benchmark mode |
| Run Skipped | Enables skipped test execution |
Context Menu options:
| Option | Description |
|---|---|
| Run | Execute test |
| Profile | Profile test |
| Copy | Copy name to the clipboard |
| Copy URL | Copy the test's link to the clipboard |
| Copy URL(running) | Copy the test's link to the clipboard. Opening this link would invoke test |
| Run Force | Execute test even if it is marked as skipped |
Test Execution
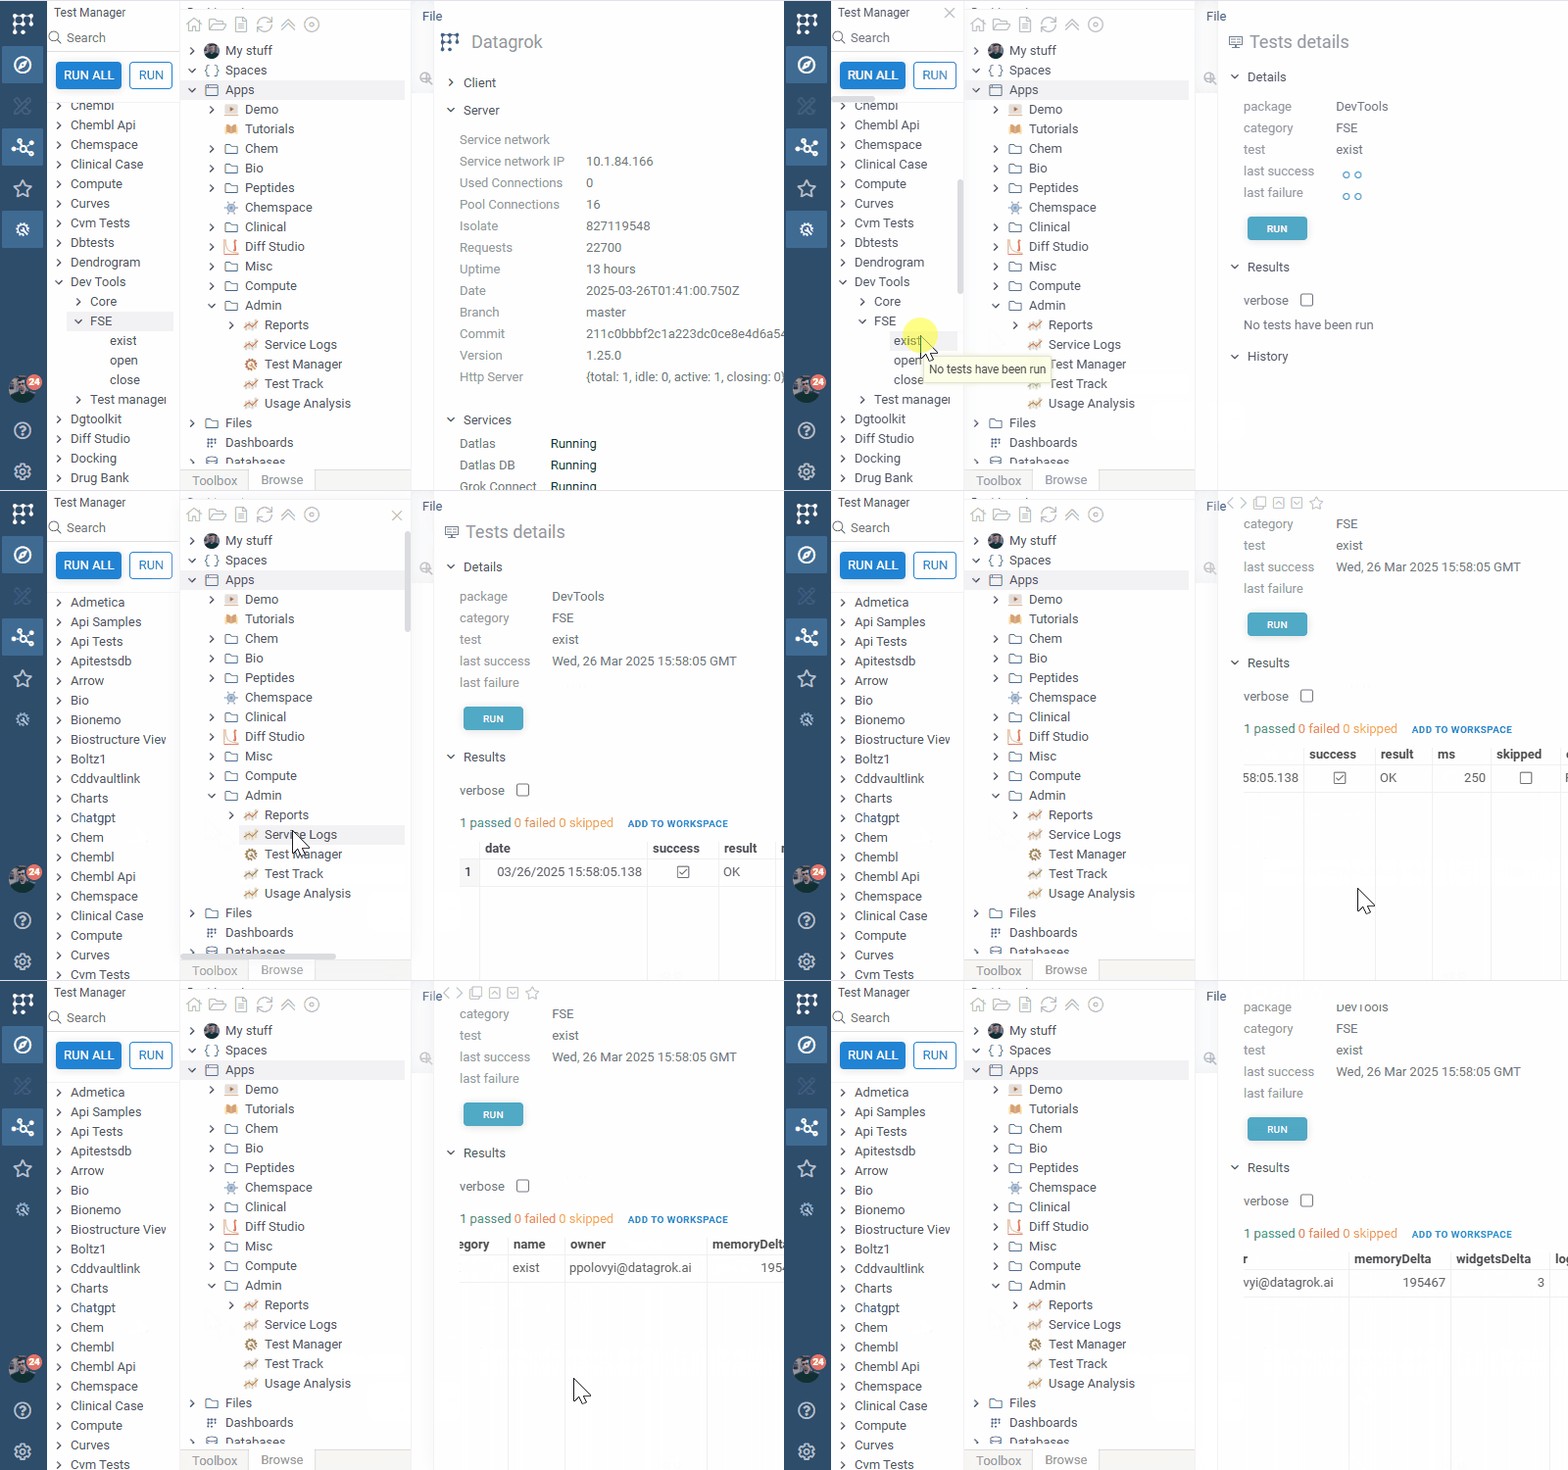
With Test Manager, you can easily navigate the hierarchical structure of tests to execute individual tests or categories. To run a test, use one of the following methods:
- Click the Run button.
- Right-click on the test or category and select Run.
Once a test has executed, the results will be displayed in the Context Panel, where you can review:
- Test Status (Success, Failure, etc.)
- Memory Usage (
memoryDelta) - Execution Time (
ms) - UI Impact (
widgetsDelta) - Test Owner (
owner)

Test Debugging
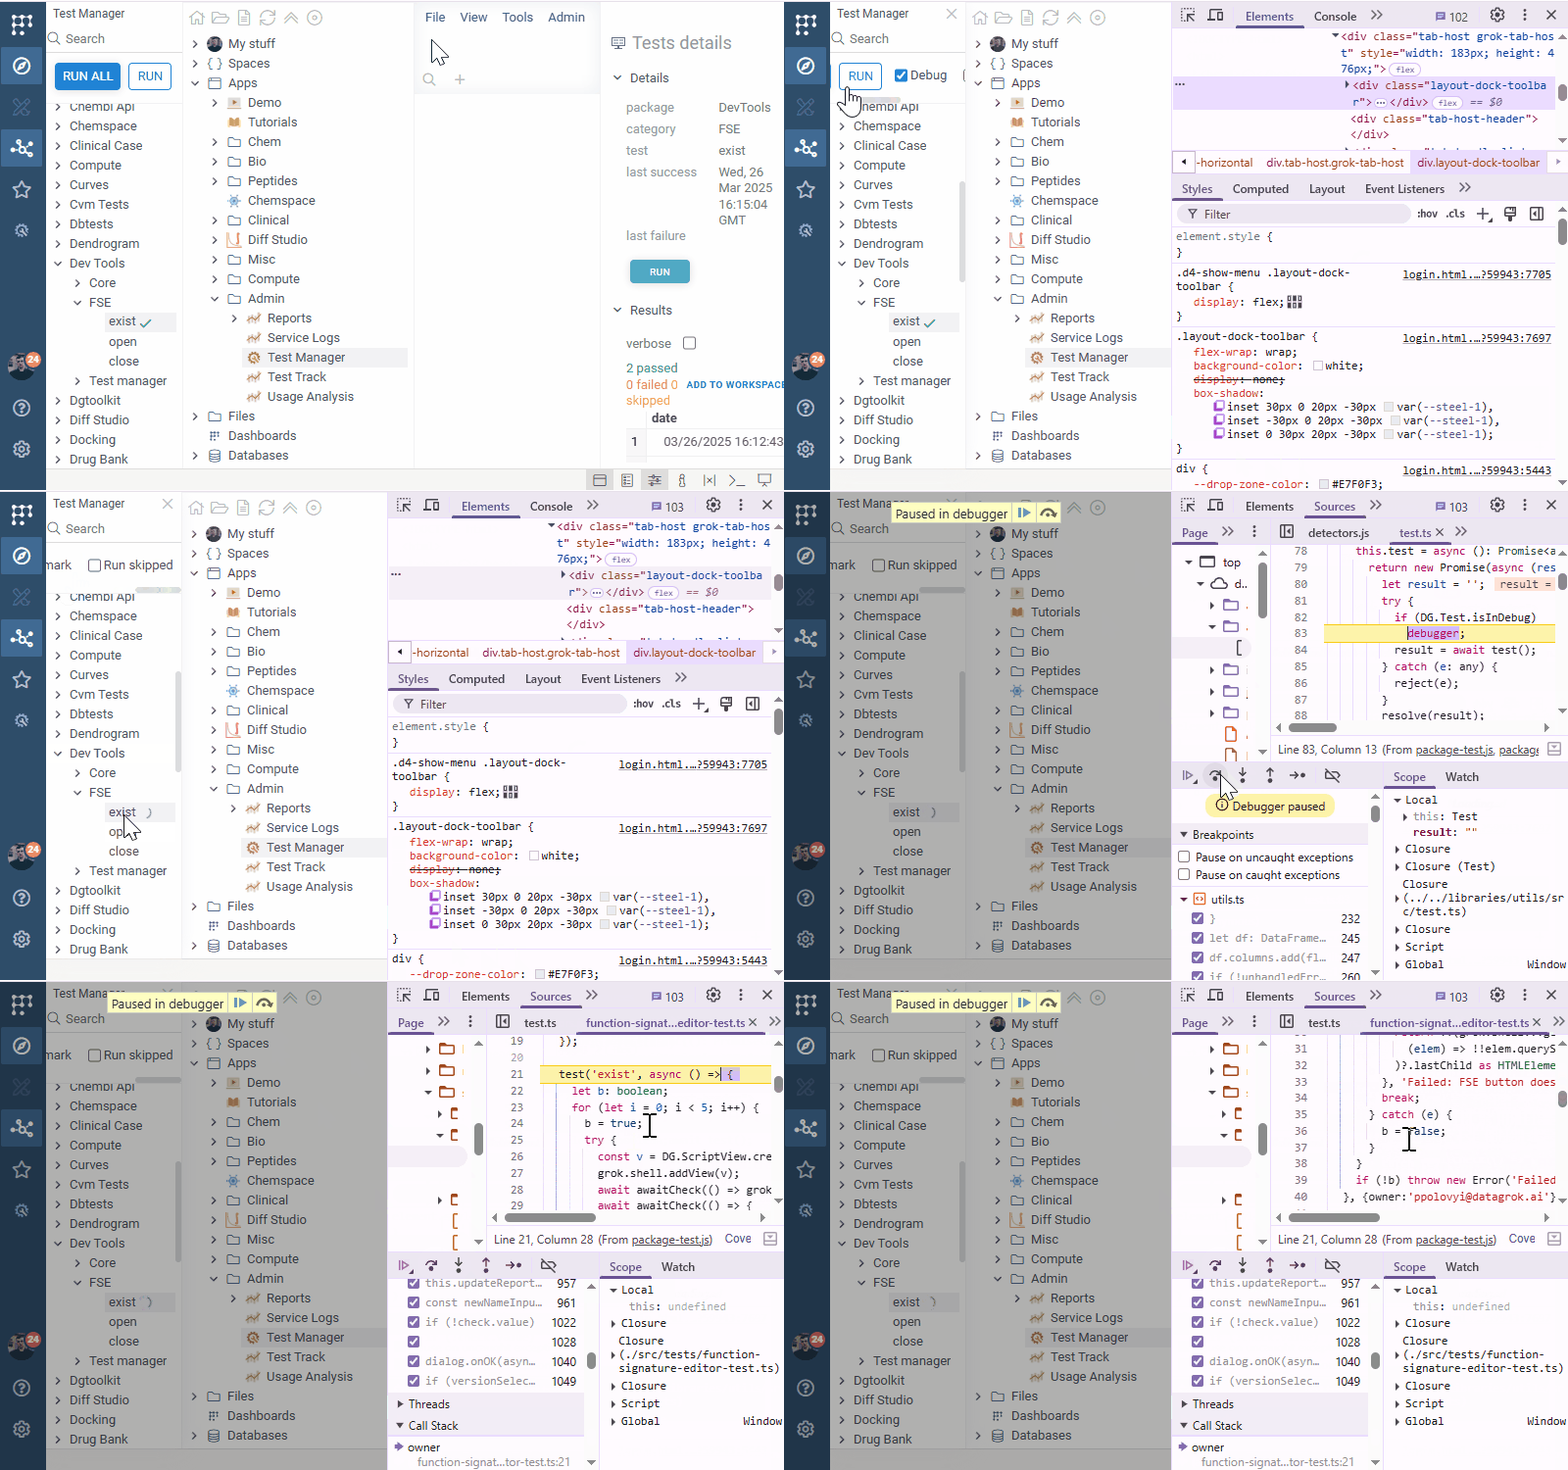
Test Manager makes debugging simple and efficient. Follow these steps to debug a test:
- Select Debug under the Search input.
- Open the Browser Inspector (F12).
- Execute the test—execution will pause at the test invocation point.
- Use Step Into to debug the test step by step.
This method allows you to pinpoint issues and verify test behavior effectively.

Test Profiling
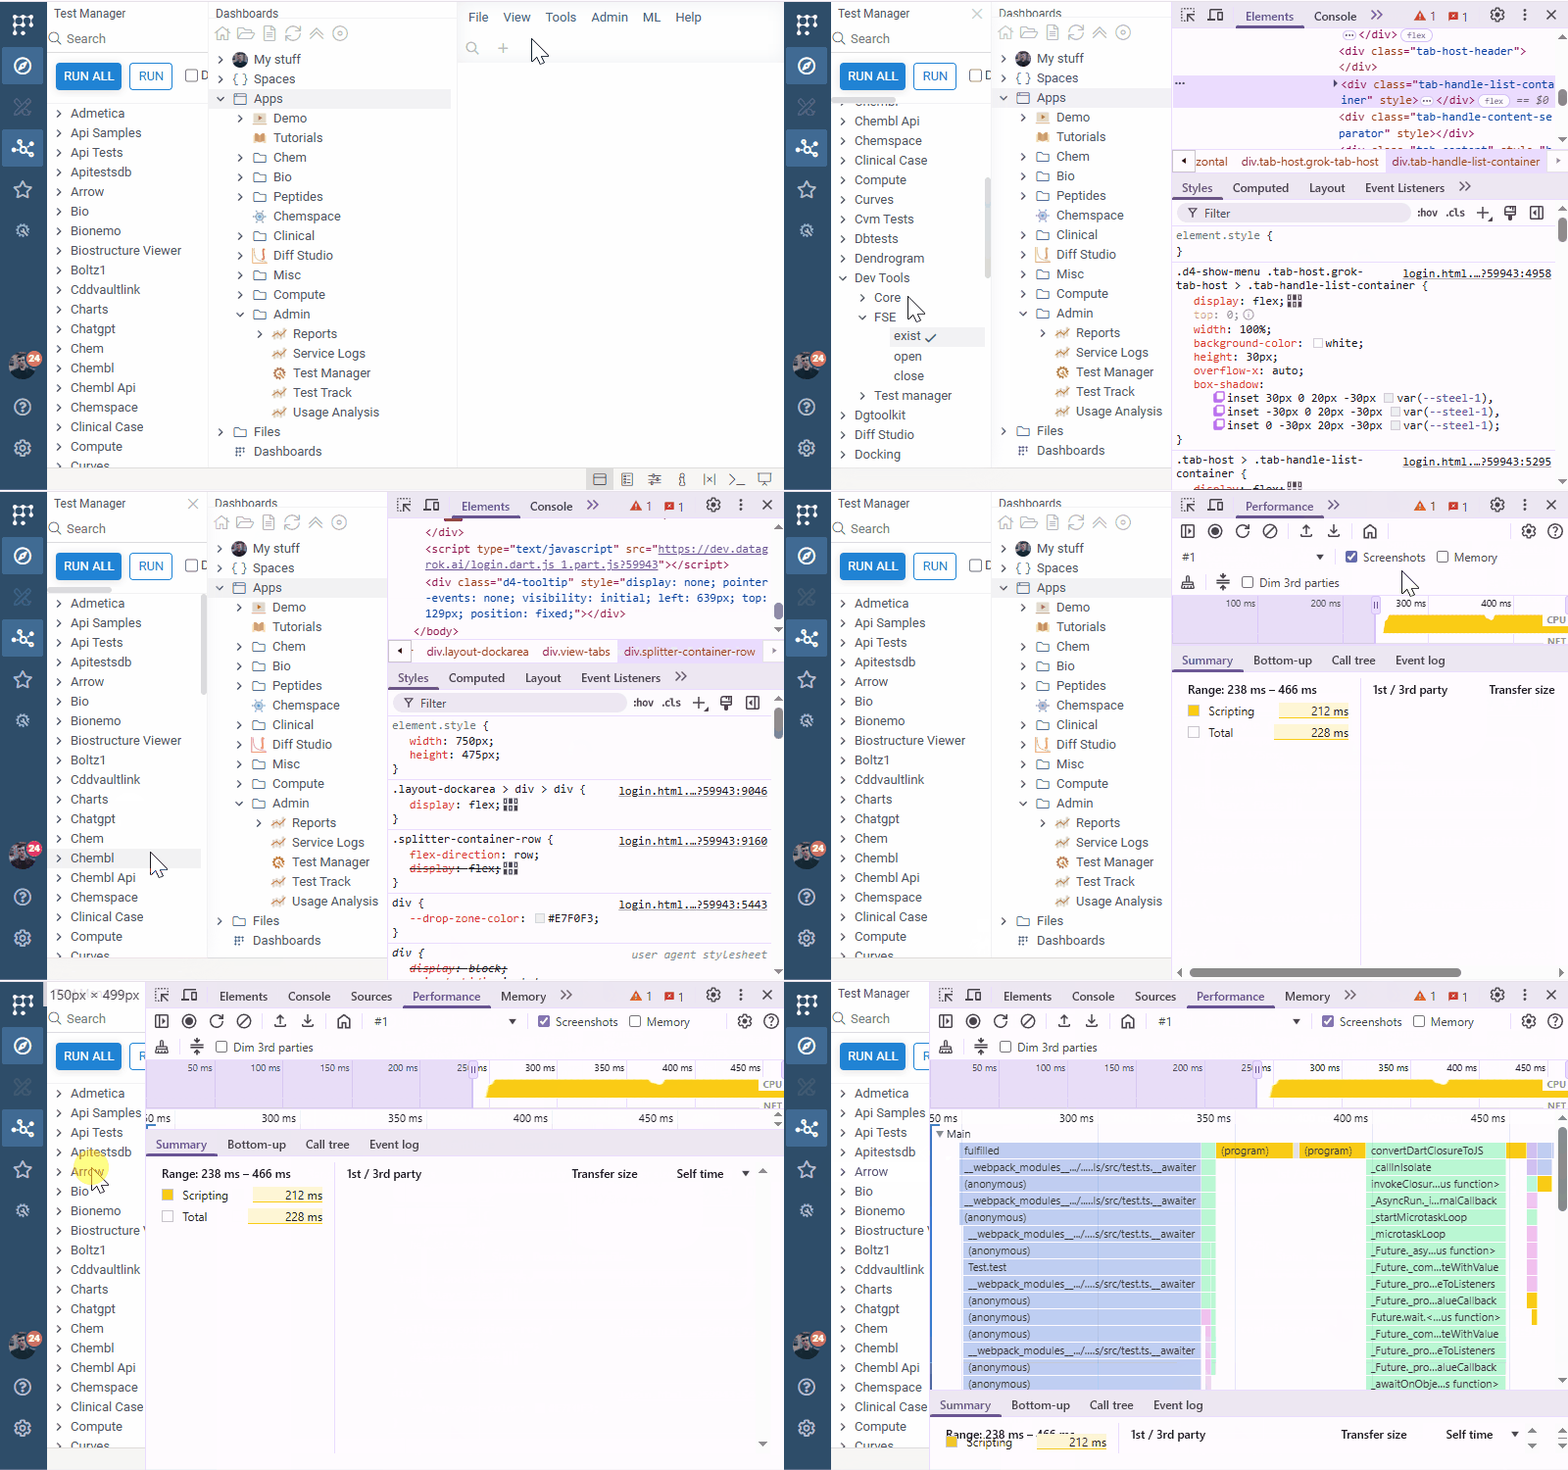
For deeper insights into test execution, Test Manager provides a profiling feature. Follow these steps to profile a test:
- Open the Browser Inspector (F12).
- Right-click on the test and select Profile.
- Navigate to the Performance tab in the Inspector.
- Analyze the test execution timeline and performance metrics.
Profiling helps identify performance bottlenecks and optimize test execution times.
