Inspector is a tool for developers that lets you see and interact with the platform internals.
To activate, press Alt+I. It consists of the following panels:
Recent events
Useful to understand the flow of events. Shows the total count of events by category, and highlights most recent events.
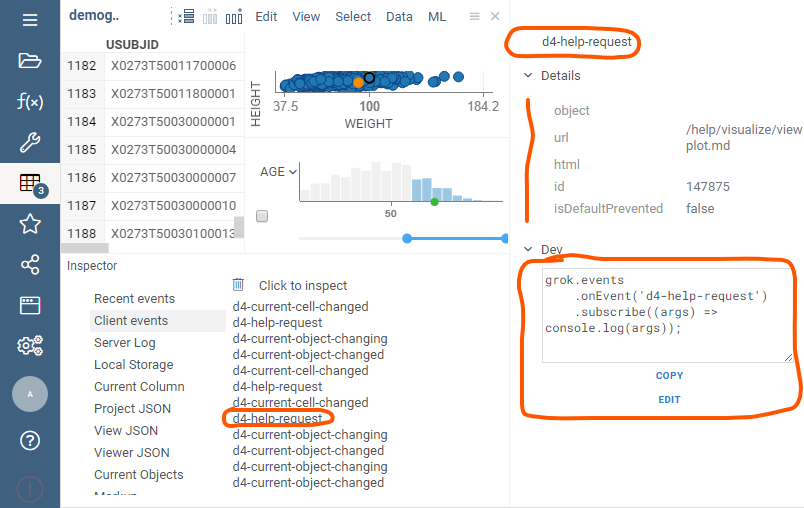
Client events
Shows individual events in the order as they come. Click on the event to see its details in the context panel. See how to handle such event in JavaScript in the "Dev" panel.
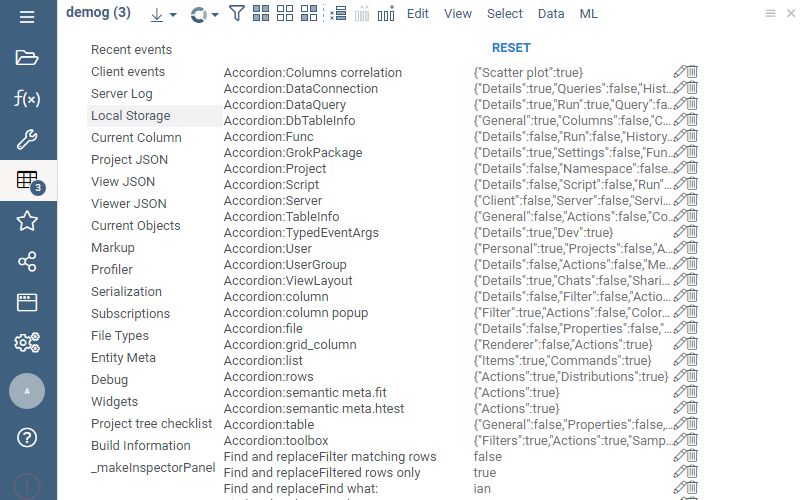
Local storage
See and edit the data stored in the local storage. The same information is also available in the Chrome Dev Tools.
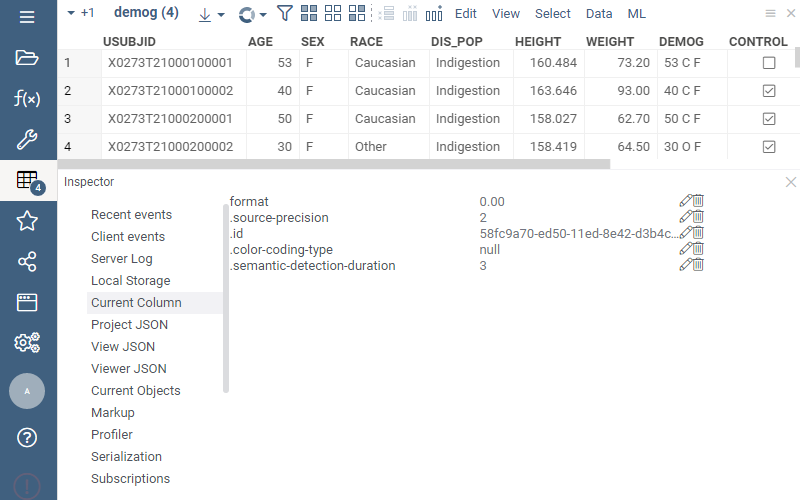
Current column
Shows internal data for the current column.
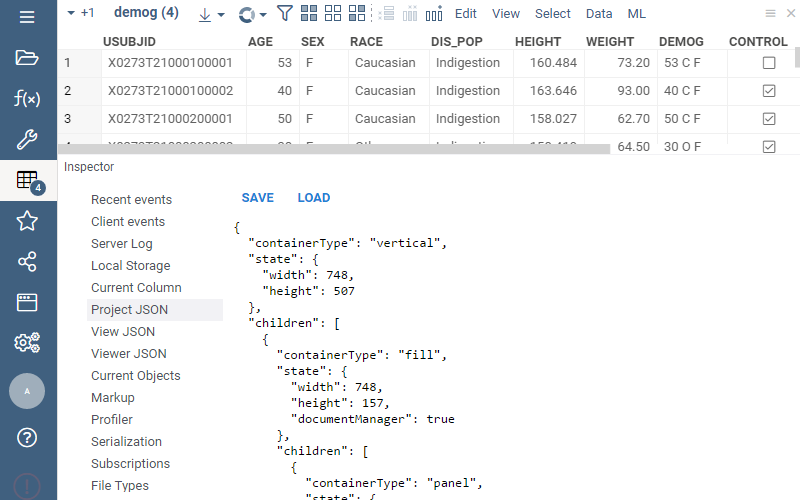
Project JSON
JSON-serialized project (views, viewers, additional information).
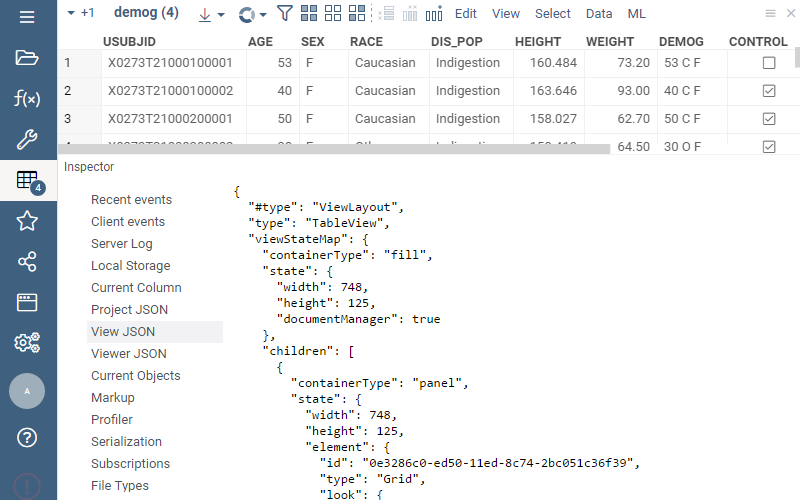
View JSON
JSON representation of the current view (layout + viewers).
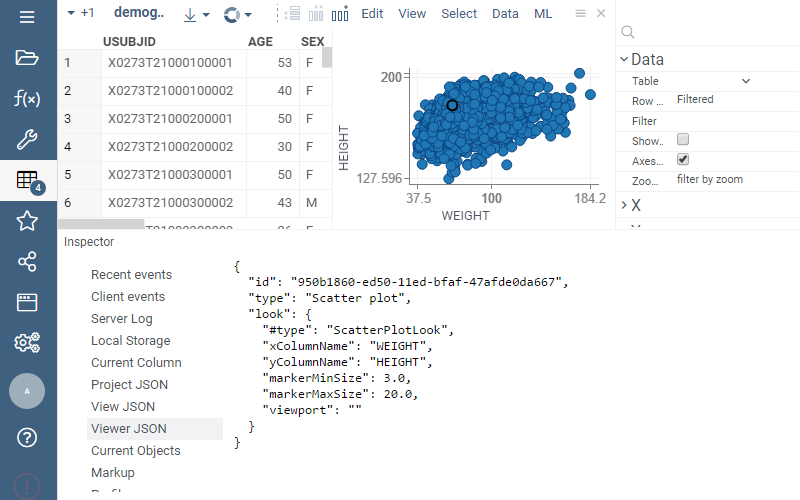
Viewer JSON
JSON representation of the current viewer (viewer type, properties)
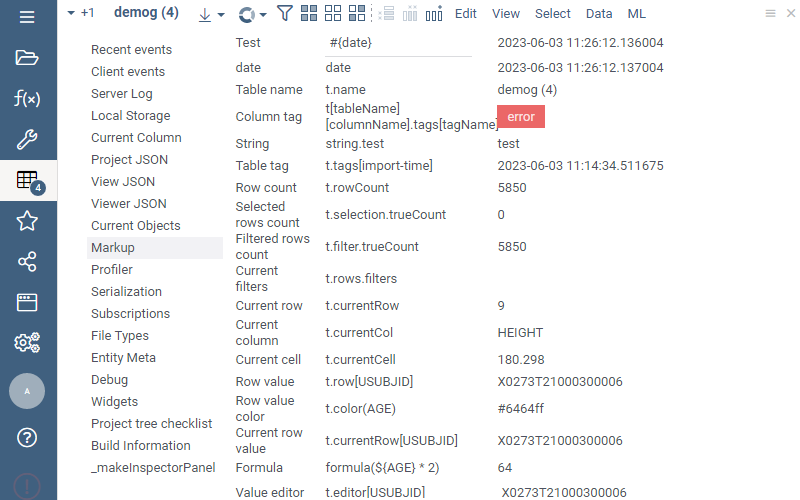
Markup
Different kind of data bindings supported in the Markup Viewer, evaluated against the current table.
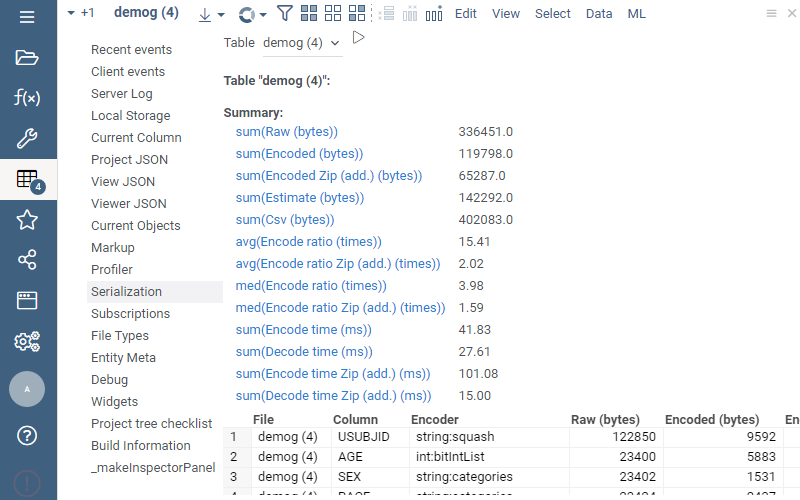
Serialization
Detailed information on how the table is serialized in the binary format, including compression ratios and performance characteristics for all applicable codecs for all columns.
File types
Registered tabular data file types.
Entity meta
Registered metadata descriptors.
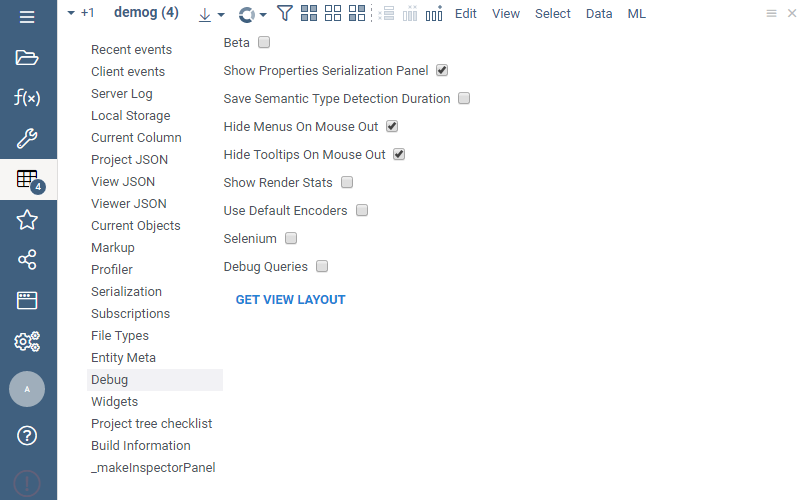
Debug
Lets you configure a set of debugging options.
Widgets
Lets you inspect all widgets that are currently alive. Use it for finding memory leaks.