Viewer event scripts
Bring more interactivity to your dashboards by defining custom event handlers. For instance, you can make a REST call, and show additional information when a user double-clicks a point on a scatter plot. The event handler is defined as a JavaScript code that gets invoked when a particular event occurs. The code is saved in the viewer settings, so it gets saved along with the projects or view layouts.
To turn it on, check Settings | Beta | Allow Event Scripts
To define an event handler:
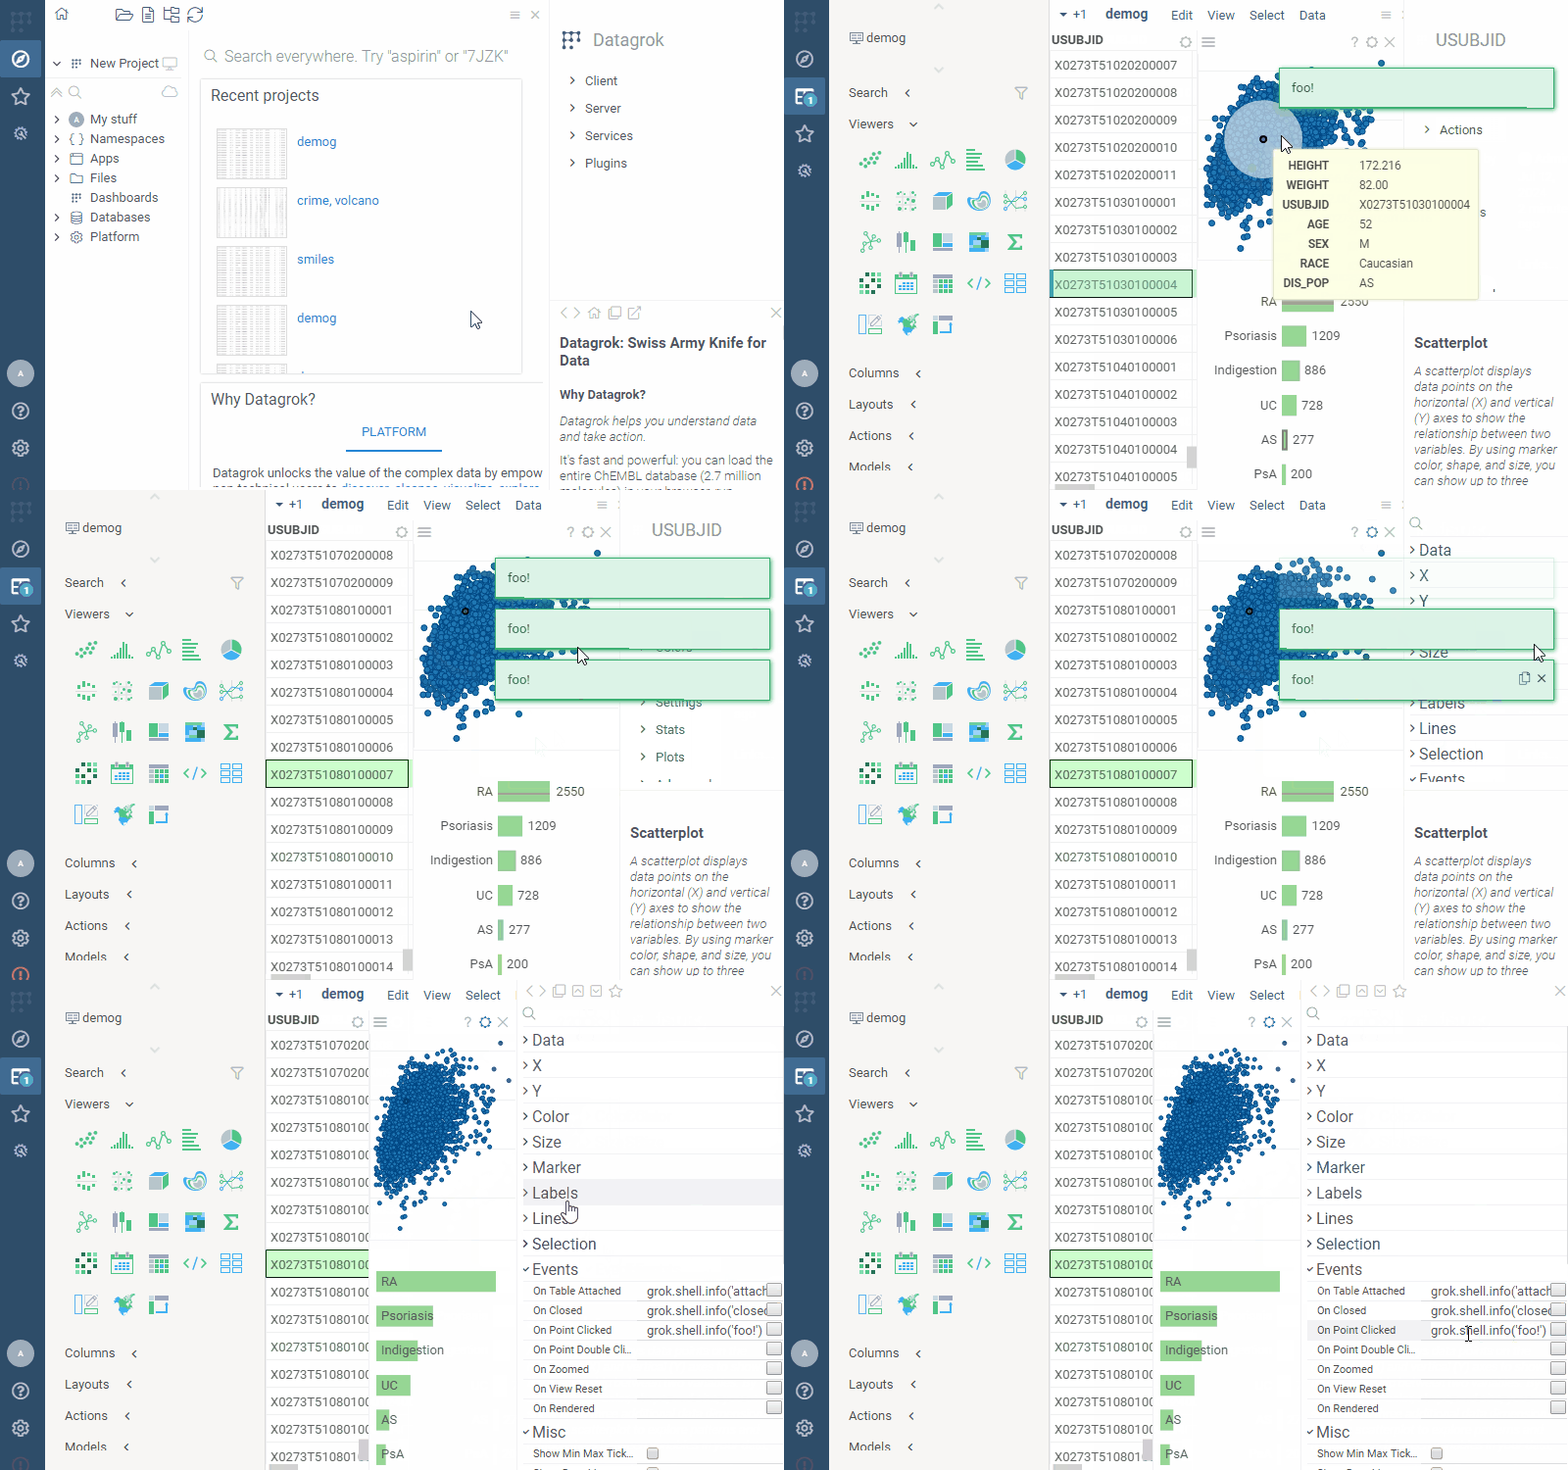
- Open viewer settings by clicking on the "gear" icon
- Under the "Events" pane, find the event of interest
- Edit the script, using the
argsandviewervariable to get event context. See examples below.
The following picture demonstrates how a few custom events are automatically activated when the project is opened:

Examples
Scatter plot: On Rendered: rendering custom text
args.sender.canvas.getContext('2d').fillText('foo', 100, 100);
Scatter plot: On Point Clicked: show custom information when a point is clicked
grok.shell.o = ui.divText('Clicked on ' + args.args.rowId);
Grid: On Cell Clicked
grok.shell.info('Clicked on ' + args.data.cell.column.name + ' : ' + args.data.cell.rowIndex)
Bar chart: On Category Clicked: clicking on a category
grok.shell.info(args.args.matchConditionStr);