Aggregate rows
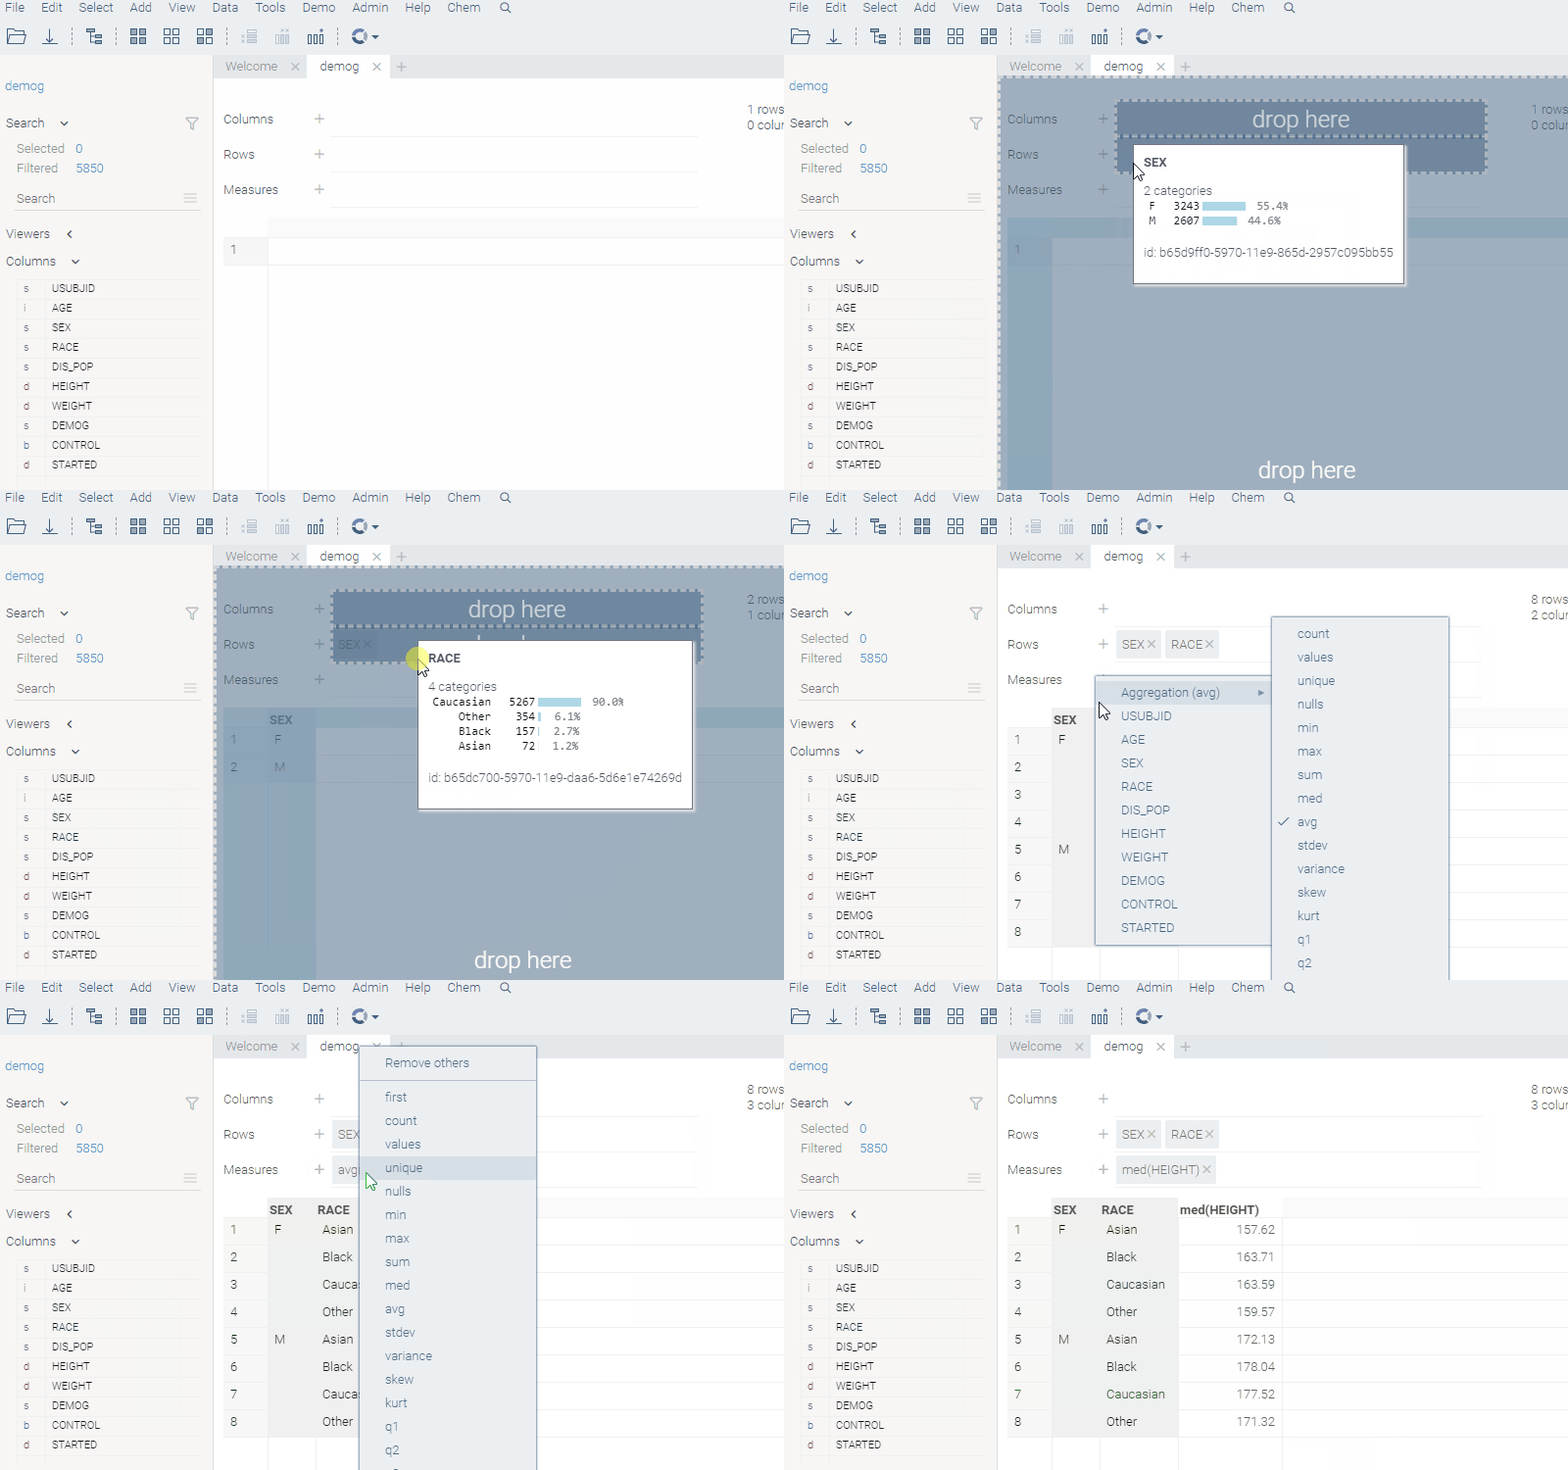
This tools allows to interactively define aggregation logic, and immediately see results in the preview window.
To define a column to be used as a key, add it to the "Rows" section (unique values will become row identifiers). To do so, either use "+" sign, or drop a column into the corresponding field (you can drag it out of the grid). More than one column can be used as a key.
To calculate an aggregate value of the column, add it to the "Measures" section. Either use the "+" sign, or drop a column into the corresponding field. To specify aggregation function to use, right-click on the column and select it from the list. In case you are adding multiple columns using the same aggregation function, you can set it as default by pressing the "+" sign and choosing it under the "Aggregation" submenu.
To pivot the dataset (group values in columns), use the "Columns" section.
When you are done, click OK to add the aggregated table to the workspace. As with many dialogs, use the history option ( watch icon in the left bottom corner) to access previously used aggregation options.

Videos
See also:
