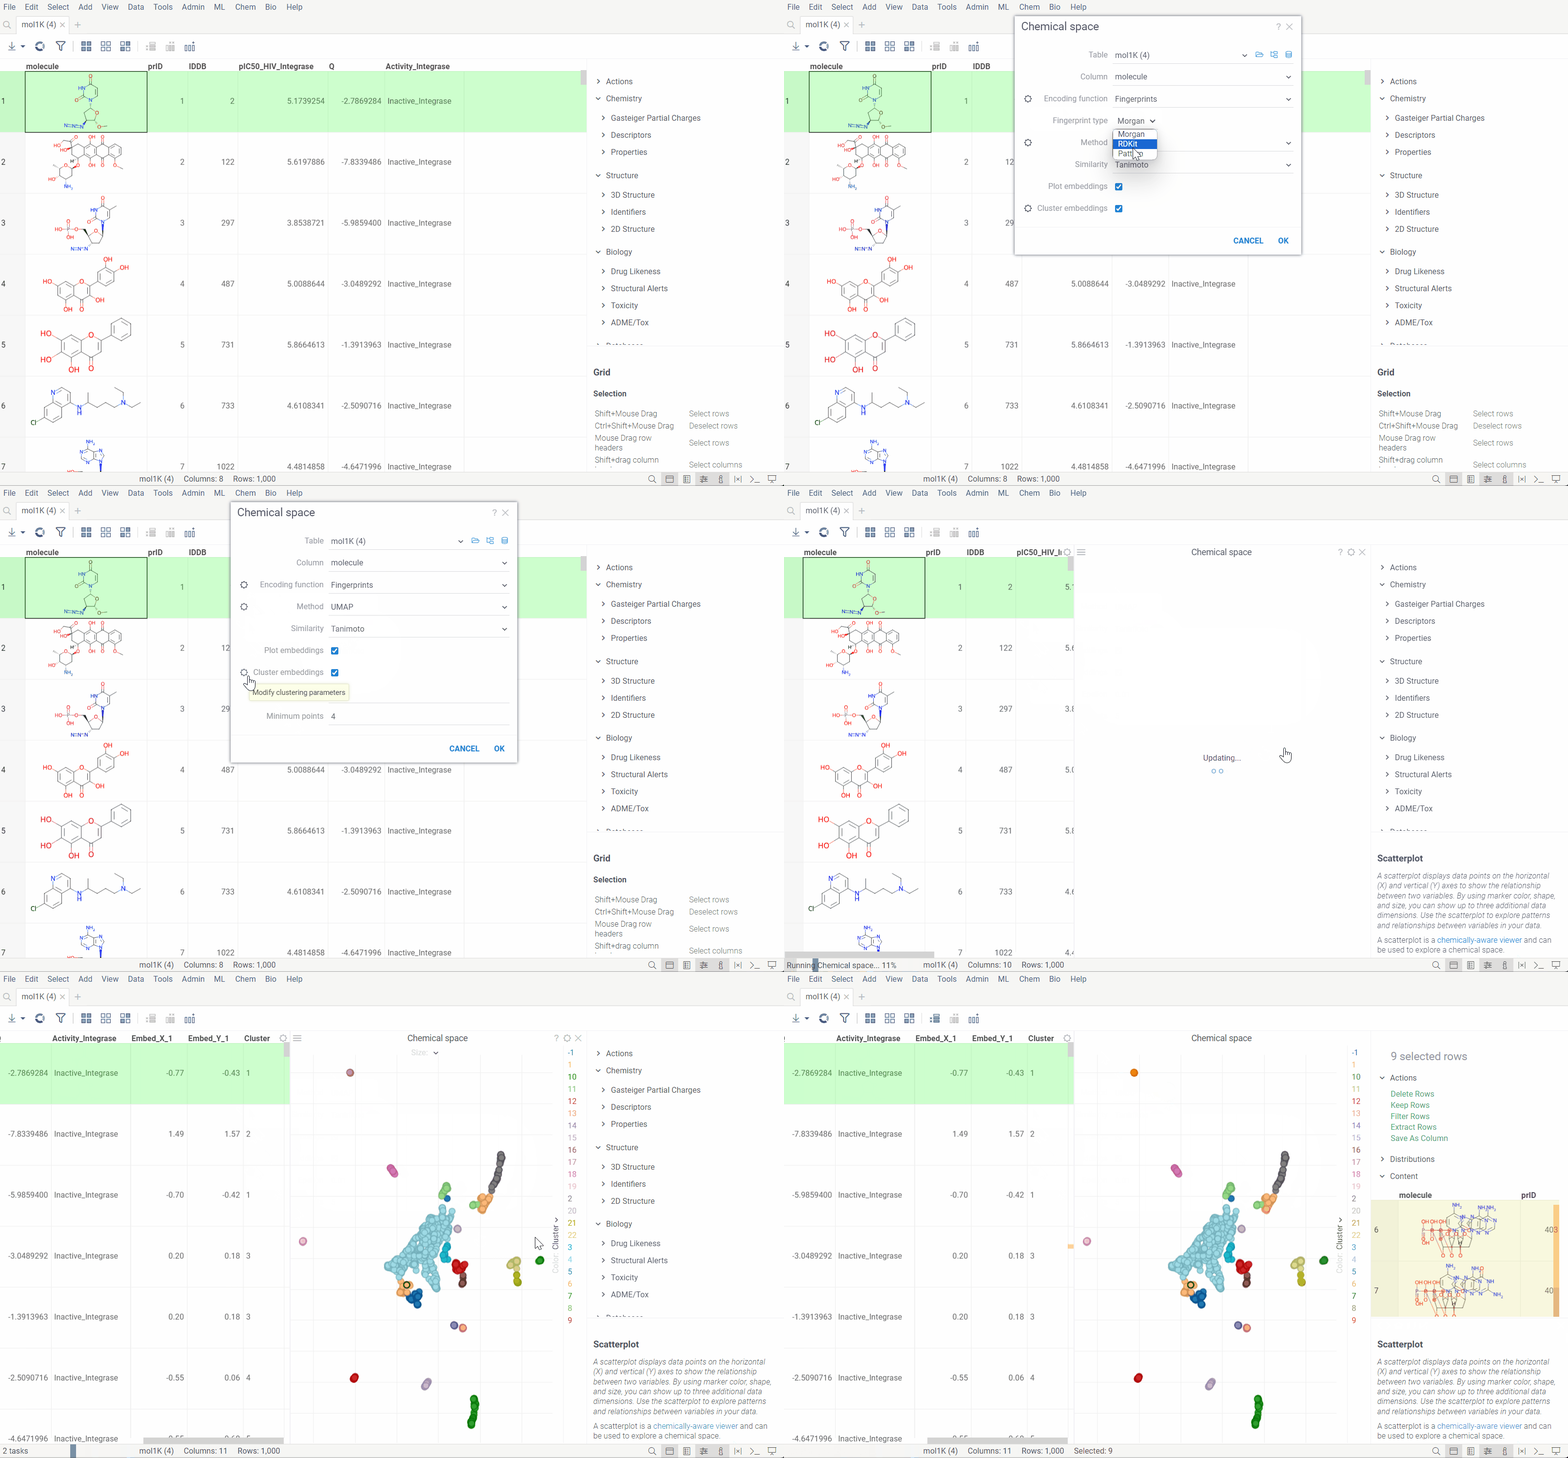
Chemical Space
Chemical space performs dimensionality reduction on a column of molecules.
Dimensionality reduction can be used to visualize high-dimensional data in two dimensions. It is particularly useful for visualizing the clusters of similar molecules on 2D scatter plot. The algorythm uses either UMAP or t-SNE, in combination with molecule fingerprint generation and bit array distance functions, to calculate pairwise distances between molecules and then reduce the dimensionality of the data.
Usage
The dialog has the following inputs:
Table: The table containing the column of sequences.
Column: The column containing the sequences.
Encoding function: The encoding function that will be used for pre-processing of molecules. Currently, only one encoding function is available, that will use chemical fingerprint distances between each molecule to calculate pairwise distances. The
Fingerprintsfunction has 1 parameter which you can adjust using the gear (⚙️) button next to the encoding function selection:- Fingerprint type: The type of molecular fingerprints that will be used to generate monomer substitution matrix. Options are
Morgan,PatternorRDKit.
- Fingerprint type: The type of molecular fingerprints that will be used to generate monomer substitution matrix. Options are
Method: The dimensionality reduction method that will be used. The options are:
UMAP: UMAP is a dimensionality reduction technique that can be used for visualisation similarly to t-SNE, but also for general non-linear dimension reduction.
t-SNE: t-SNE is a machine learning algorithm for dimensionality reduction developed by Geoffrey Hinton and Laurens van der Maaten. It is a nonlinear dimensionality reduction technique that is particularly well-suited for embedding high-dimensional data into a space of two or three dimensions, which can then be visualized in a scatter plot.
Other parameters for dimensionality reduction method can be accessed through the gear (⚙️) button next to the method selection.
Similarity: The similarity/distance function that will be used to calculate pairwise distances between fingerprints of the molecules. The options are:
Tanimoto,Asymetric,CosineandSokal. All this distance functions are based on the bit array representation of the fingerprints.Plot embeddings: If checked, the plot of the embeddings will be shown after the calculation is finished.
Cluster embeddings: If checked, the embeddings will be clustered using the DBSCAN algorithm. The DBSCAN algorithm groups together points that are closely packed together (points with many nearby neighbors), marking as outliers points that lie alone in low-density regions (whose nearest neighbors are too far away). The DBSCAN algorithm has two parameters that you can adjust through the gear (⚙️) button next to the cluster embeddings checkbox:
- Epsilon: The maximum distance between two points for them to be considered as in the same neighborhood.
- Minimum points: The number of samples (or total weight) in a neighborhood for a point to be considered as a core point. This includes the point itself.
