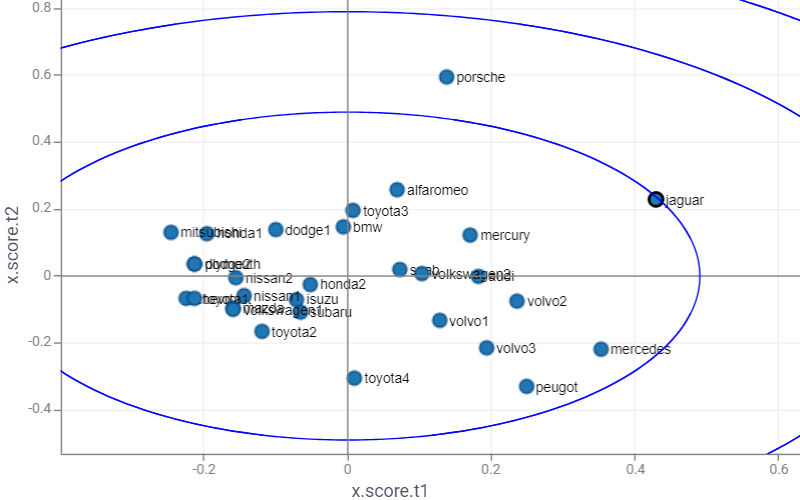
Scores
The Scores scatterplot shows the values of the latent factors for each observation in the dataset:
- the predictors (T-scores)
- the response variable (U-scores).
It indicates correlations between observations (how observations related to each other, occurrence groups or trends).
Combine it with the Observed vs. Predicted scatterplot to explore data samples: