Loadings
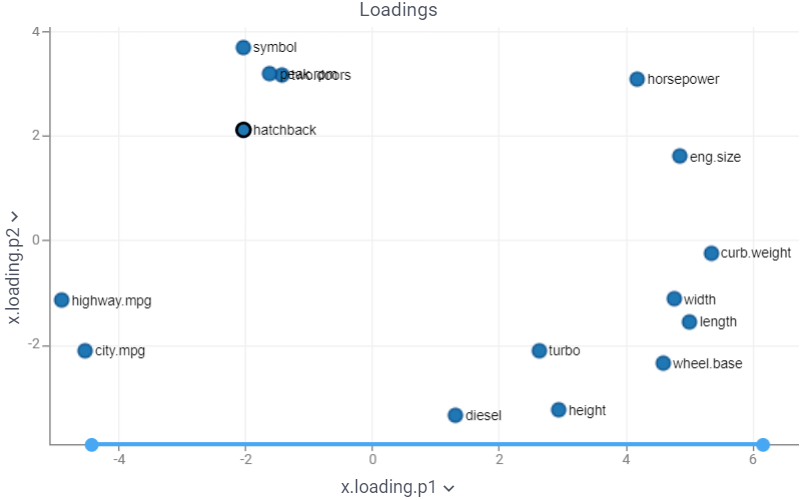
The Loadings scatterplot visually represents the influence of each feature on the latent factors: high loadings indicate a strong influence.

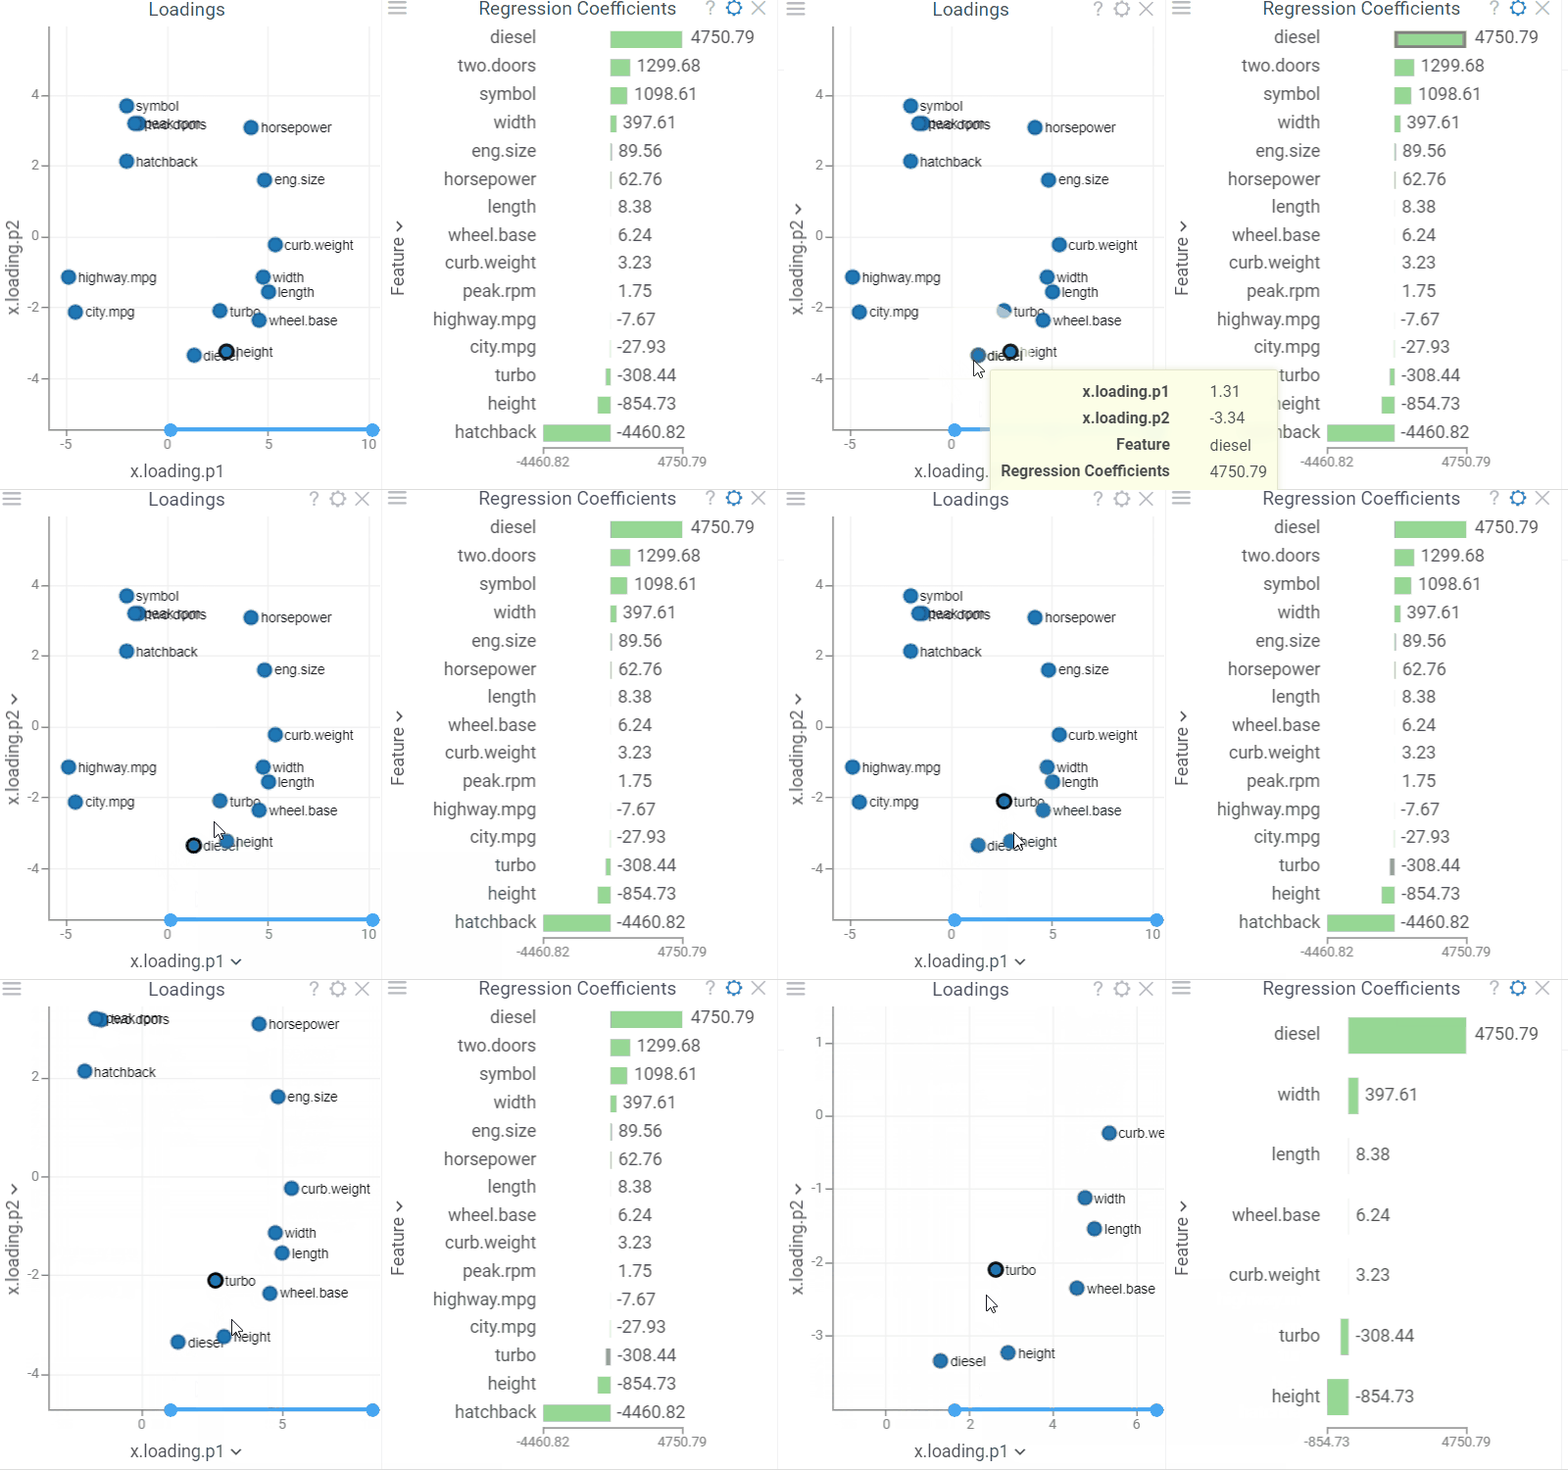
Use it in combination with the Regression Coefficients bar chart to explore features:

The Loadings scatterplot visually represents the influence of each feature on the latent factors: high loadings indicate a strong influence.

Use it in combination with the Regression Coefficients bar chart to explore features:
