Data augmentation
Data augmentation adds value to base data by adding information derived from internal and external sources within an enterprise. Data is one of the core assets for an enterprise, making data management essential. Data augmentation can help reduce the manual effort required to developed meaningful information and insight of business data, as well as significantly enhance data quality.
One of Datagrok's goals is to surface relevant information whenever you need it. In many cases, this means presenting augmented data automatically. Here are a few examples:
- Showing quick data summary in the column tooltip
- Histogram
- Basic statistics
- Highlighting missing value
Suggesting applicable view and viewer layouts
Whenever you open a table, the platform analyzes its structure and determines whether any of the previously used layouts (not necessarily by you) can be used to visualize that dataset. It then suggests these layouts to you, even showing the preview of how the data would look like if visualized with that layout.
Suggesting applicable predictive models
Whenever a table is open, the platform suggests predictive models that can be applied to the table. Then you can predict the outcome in one click.
Suggesting applicable actions
Using the repository of functions (over 200+ functions), historical activity, and the structure of the current table, the system uses AI techniques to suggest actions that are likely to be relevant at the moment. For instance, if it finds a column that looks like street address, it will suggest to convert it to geographical positions by doing the geo-coding and adding two columns (longitude, latitude). Or, it may suggest to enrich the current dataset by extracting 50+ statistics associated with the location (using US census data available on the platform).
Manual augmentation
The suggestion mechanism is quite powerful, but oftentimes you know exactly how you want to augment the data. To get the external data on demand, use an extensive collection of data connectors. Use parameterized queries to retrieve external data for each record (or do it on demand whenever the current record changes), and visualize the results with Markup Viewer for complex data, or Form for scalars.
Info panes
Info panes provide additional information about the current context (which can be a table, a column, or any other object). Info panels are meant to be easily developed by the users of the platform, and shared with other users. You can use all features of the Datagrok platform, such as scripting, data querying and transformation pipeline, user-defined functions, markup, viewers, predictive models.
Here is an example of molecule-related info panes in action. Whenever a user clicks on a molecule, a number of info panes get shown (collapsed by default). In a picture, we see a pane with the predicted toxicity properties, predicted solubility, and a visualization of the atom charges. All of these results get calculated or rendered dynamically. These info panes can be implemented externally as scripts; for instance, here is the source code of the "Gasteiger Partial Charges" panel. See public repository for details on how to contribute to the public repository of scientific functions.
Identifiers
Datagrok allows you to easily detect and handle specific patterns in text across the platform. For example, you can configure Datagrok to recognize CHEMBL identifiers (a common format used in chemical databases) and retrieve relevant information, such as compound structures, to display in tooltips or info panes.
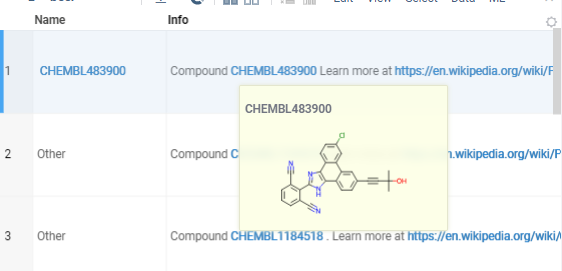
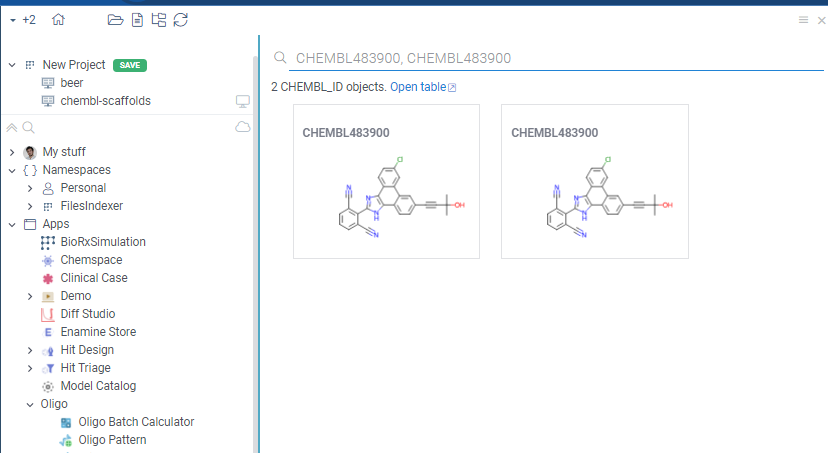
To register an identifier pattern and handler, follow the instructions provided here. Once set up, Datagrok will automatically detect, highlight and handle the identifiers in text. You can also search for the identifiers using the "Search Everywhere" feature, and Datagrok will display the relevant information in the search results.
See also: