Complex data types
For the full correspondence between Datagrok types and their native equivalents in Python, R, Octave, Julia, and JavaScript, see Data types.
Working with dataframes
For table data, Datagrok supports Dataframe as input/output parameters.
You can pass to the script the whole dataframe (dataframe type),
dataframe column (column), or list of columns (column_list).
A simple example of a dataframe usage is available on the Getting started with scripting page.
Let's modify the default example to accept and return both dataframes and scalars. We copy the original dataframe and add a new ID column to it. Also, we return the number of rows in the table.
- Result
- Python
- R
- JavaScript
When you run the script, you will see the following dialog:
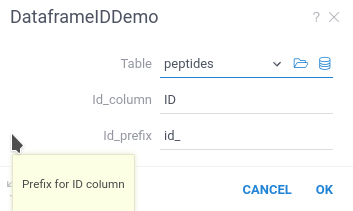
Datagrok created the script UI, populated default values, and created popups with help text.
#name: DataframeIdDemo
#description: Adding ID column to a dataframe
#language: python
#input: dataframe table [Data table]
#input: string id_column = 'ID' [Name of ID column]
#input: string id_prefix = 'id_' [Prefix for ID column]
#output: dataframe new_table [New table with additional column]
#output: int last_row [number of last row]

new_table = table.copy()
l = len(new_table)
new_table[id_column] = [f"{id_prefix}{n:04}" for n in range(l)]
last_row = len(new_table)
#name: DataframeDemo
#description: Adding a new column to a dataframe
#language: r
#input: dataframe table [Data table]
#input: string id_column = 'ID' [Name of ID column]
#input: string id_prefix = 'id_' [Prefix for ID column]
#output: dataframe new_table [New table with additional column]
#output: int last_row [number of last row]

new_table <- table
new_table[id_column] <- paste0(id_prefix, 1:nrow(new_table))
last_row <- nrow(new_table)
//name: DataframeIdDemo
//description: Adding ID column to a dataframe
//language: javascript
//sample: cars.csv
//input: dataframe table [Data table]
//input: string id_column = 'model' [Name of ID column]
//input: string id_prefix = 'id_' [Prefix for ID column]
//output: dataframe new_table [New table with additional column]
//output: int last_row [number of last row]

const new_table = table.clone();
const last_row = new_table.rowCount;
new_table.col(id_column).init((i) => `${id_prefix}${i}`);
After running this script, Datagrok automatically opens the new dataframe. It will contain an additional column ID with the generated row ID.
In Datagrok, unlike Python/R dataframes, column names are case-insensitive.
If you return a dataframe with columns whose names differ only by letter case,
Datagrok will automatically add a number to the column header to differentiate them.
To prevent any confusion or issues with column names, we recommend using unique names that are distinct regardless of case.
Column inputs for dataframe
Datagrok provides you with data inputs to select one or multiple columns from a dataframe.
- The
columninput parameter allows you to select one column from the dataframe. In the script, thecolumnparameter is a string variable containing header name of the selected column. - The
column_listinput parameter allows you to select multiple columns from the dataframe. In the script, thecolumn_listparameter is a list of strings containing header names of the selected columns.
Both of these selectors require at least one Dataframe input to choose a dataframe.
- Result
- Python
- JavaScript
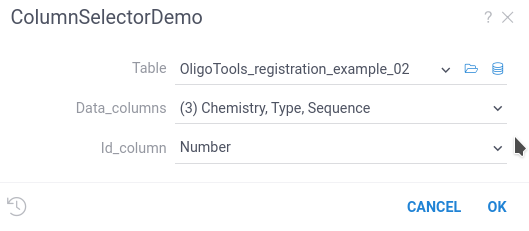
#name: ColumnSelectorDemo
#description: Using column selectors
#language: python
#input: dataframe table [Data table]
#input: column id_column [Fill this column with auto-d=generated ID]
#input: column_list data_columns [Keep this column and drop all others]
#output: dataframe new_table [New table with additional column]

new_table = table.copy()
l = len(new_table)
new_table[id_column] = [f"id_{n:04}" for n in range(l)]
new_table = new_table[ [id_column] + data_columns ]
//name: ColumnSelectorDemo
//description: Using column selectors
//language: javascript
//input: dataframe table [Data table]
//input: column id_column [Fill this column with auto-d=generated ID]
//input: column_list data_columns [Keep this column and drop all others]
//output: dataframe new_table [New table with additional column]

const new_table = table.clone();
const l = new_table.rowCount;
new_table.col('model').init((i) => `${id_column.get(i)}_${i}`);
File I/O
You can use files as input or output parameters
using file and blob annotations.
The file parameter type allows you to read and write a file.
Inside the Python/R script this parameter will be a string variable
containing a path to the local file.
Reading files
When you use the file annotation for the input parameter,
Datagrok creates an interface to load the file.
- Result
- Python
- JavaScript
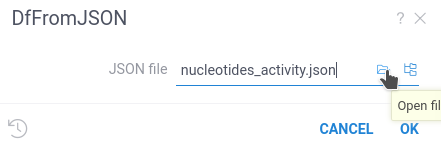
#name: DfFromJSON
#description: Loads a dataframe from JSON file
#language: python
#input: file json_file {caption:JSON file} [A JSON file to load a dataframe]
#output: dataframe df

df = pd.read_json(json_file)
//name: DfFromJSON
//description: Loads a file and returns first sheet name
//language: javascript
//input: file uploadedFile {caption:Excel file}
//output: string first_sheet_name

const importWb = new ExcelJS.Workbook();
await importWb.xlsx.load(uploadedFile.data);

first_sheet_name = importWb.worksheets[0].name;
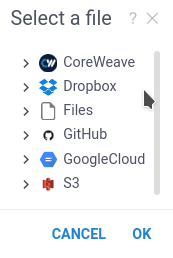
You can upload the file from your computer, choose it from Datagrok file storage, or use any of the file connectors supported by Datagrok.
The blob input works in a very similar way but provides the binary stream instead of a file name.
#name: BlobTest
#description: Example of Blob usage
#language: python
#input: blob array_blob
#output: string typeofblob

typeofblob = type(array_blob)
You can use this capability to effectively transfer a large set of data from one Datagrok function/script to another.
Saving data to files
You can use both file and blob annotations for output files.
For example, let's save a dataframe to a JSON file:
- Result
- Python
#name: DfToJSON
#description: Saves a dataframe to JSON file
#language: python
#input: dataframe df [Dataframe to convert to JSON]
#output: file json_file

df.to_json(json_file)
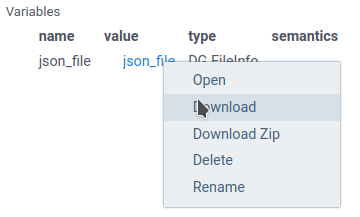
When you run this script, Datagrok will return the FileInfo object in the scalar variables panel.
To save the file, right-click on the highlighted file link and choose the Download option.
The file name always matches the output variable name.
Some Python functions (for example, Numpy Save) automatically add an extension to the file name if it is provided without an extension. In this case, Datagrok won't be able to locate the output file, and you'll see an empty file in the Datagrok output.
To override this behavior, you can open the file via the Python open function,
and use the file object instead of the file name.
#output: file array_file_binary
...
with open(array_file_binary, 'wb') as npfile:
 np.save(npfile, array)
...
Return graphical objects
Datagrok supports a special data type for transferring graphical data.
For Python, this variable can contain any graph created by the
matplotlib library (the matplotlib.figure.Figure class).
When you run the script manually, Datagrok captures the graphics object
and creates a separate tab to view the results.
Datagrok can also save the graphics output in a dataframe,
or display it in the cell properties.
Out-of-the-box Datagrok contains many blaze-fast flexible interactive viewers, suitable for almost all data visualization tasks.
We suggest exploring them before using graphical libraries of your programming language.