Info panes
Info panes provide contextual information about current objects, such as tables, queries, or molecules. The concept is similar to an email client, where clicking a subject reveals the content of an email in another pane. However, in Datagrok, info panes serve a wider range of functions, making use of all Datagrok's capabilities, including scripting, queries, functions, viewers, predictive models, and so on.
Examples:
- Details and actions
- Calculation and visualization
- Image augmentation
- Dialogs and mini apps
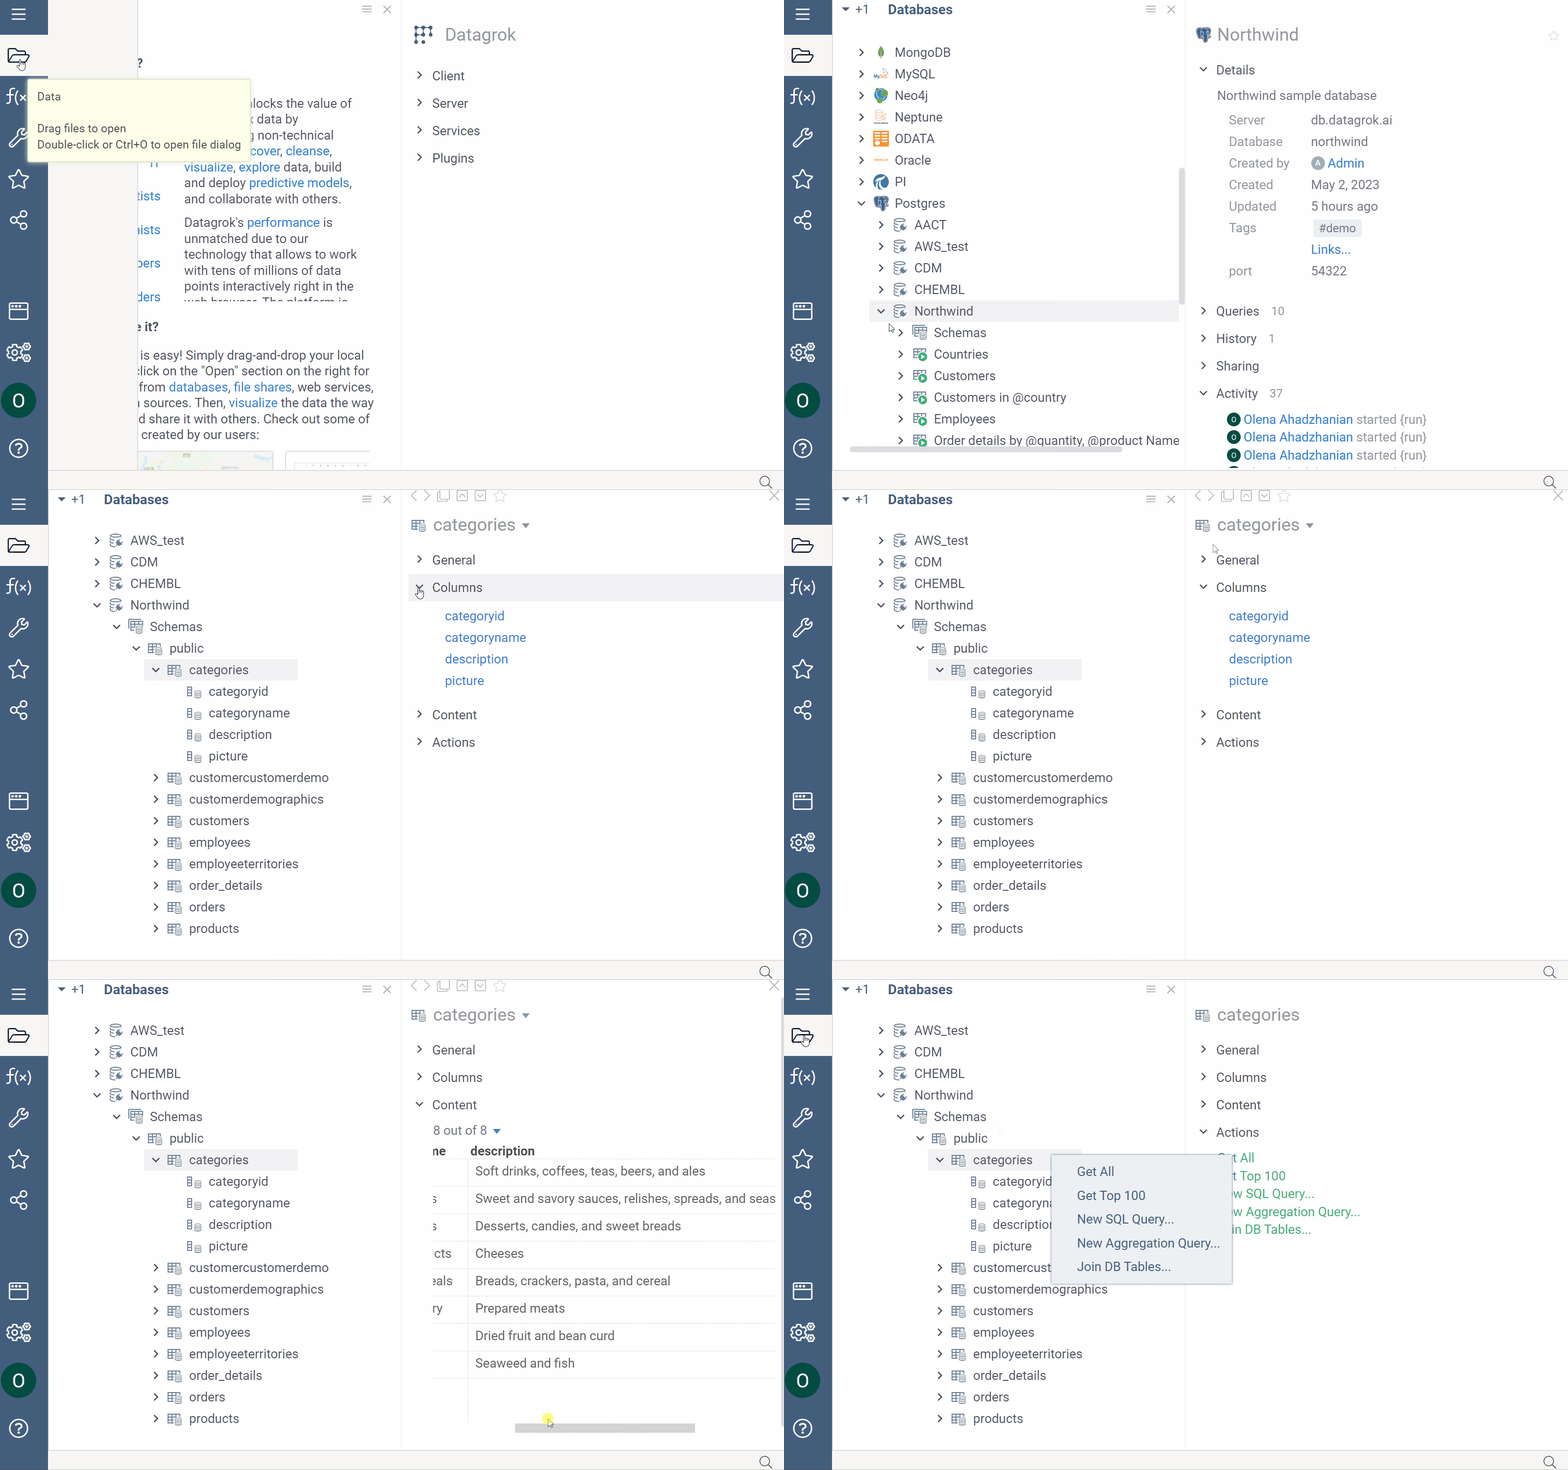
In this example, the info panes help you browse database objects, get data, and more. For example, when you click a table, the info panes let you view the table's metadata, dynamically preview the table's contents, or run queries.
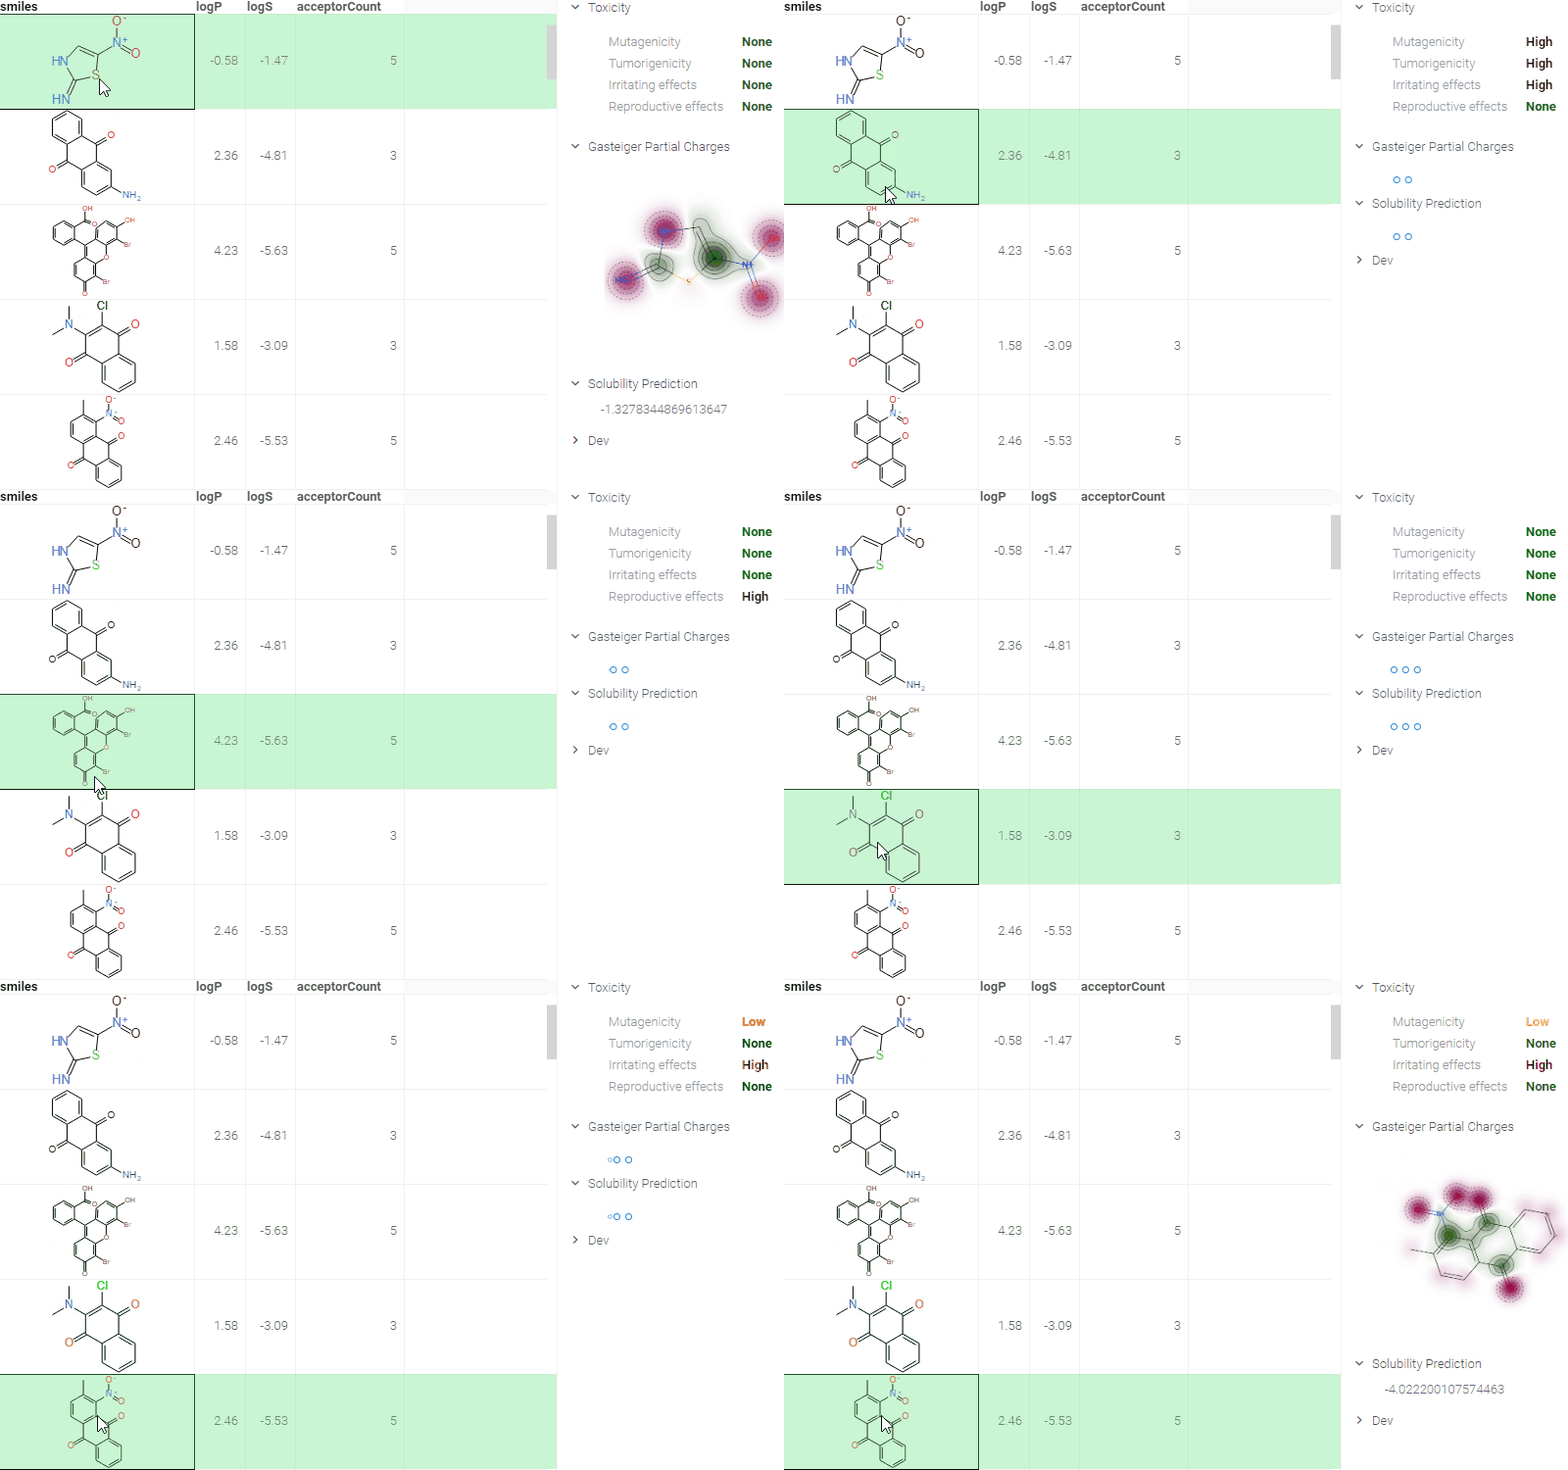
In this example, a number of scripts execute when you click a molecule, including calculation and visualization of the molecule's Gasteiger partial charges, solubility prediction, toxicity and so on. Learn more about the cheminformatics info panes.
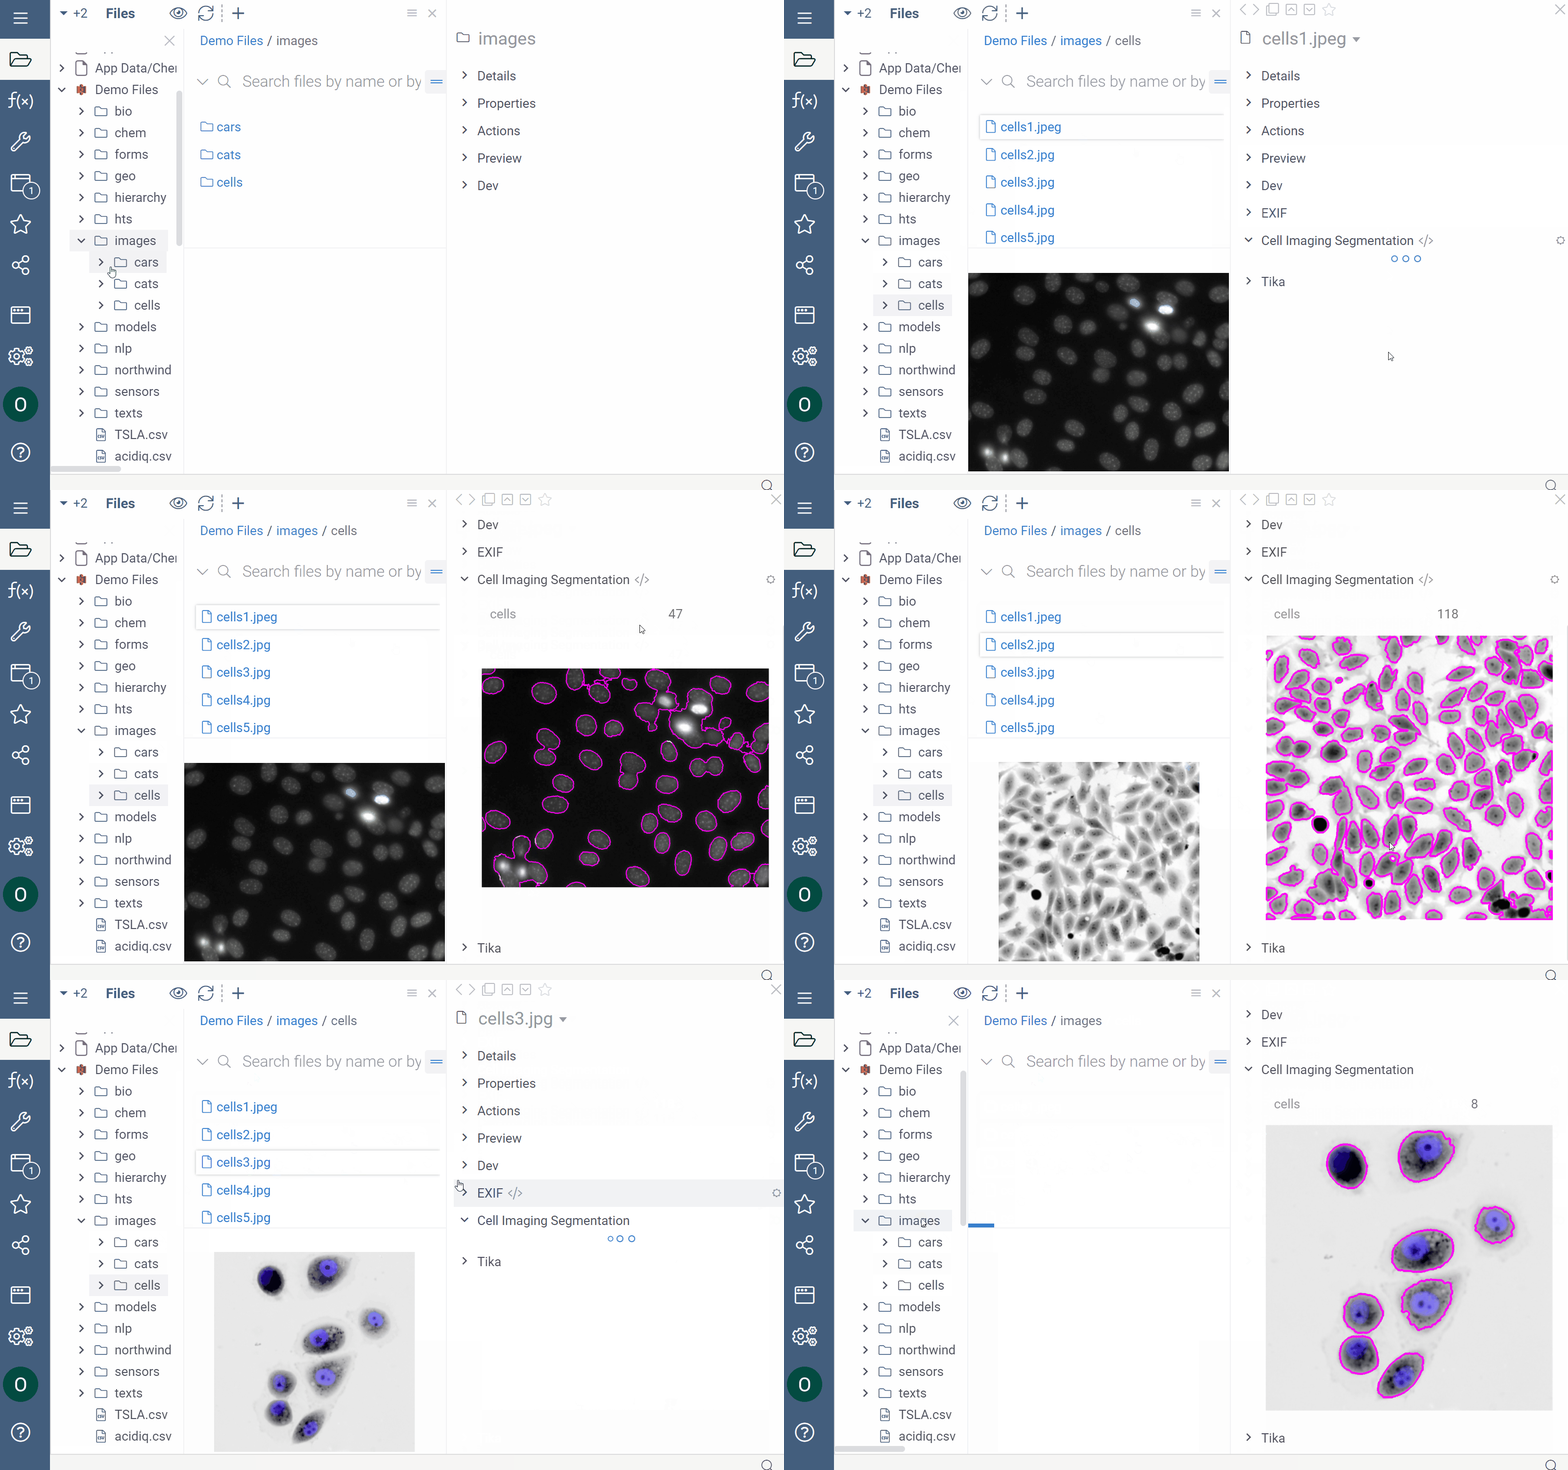
In this example, a Python script executes against JPEG and JPG files during the indexing process to get custom metadata (cell count) and performs specified transformations (segmenting cells). When you click a corresponding image, the info pane shows augmented file preview and the number of detected cell segments.
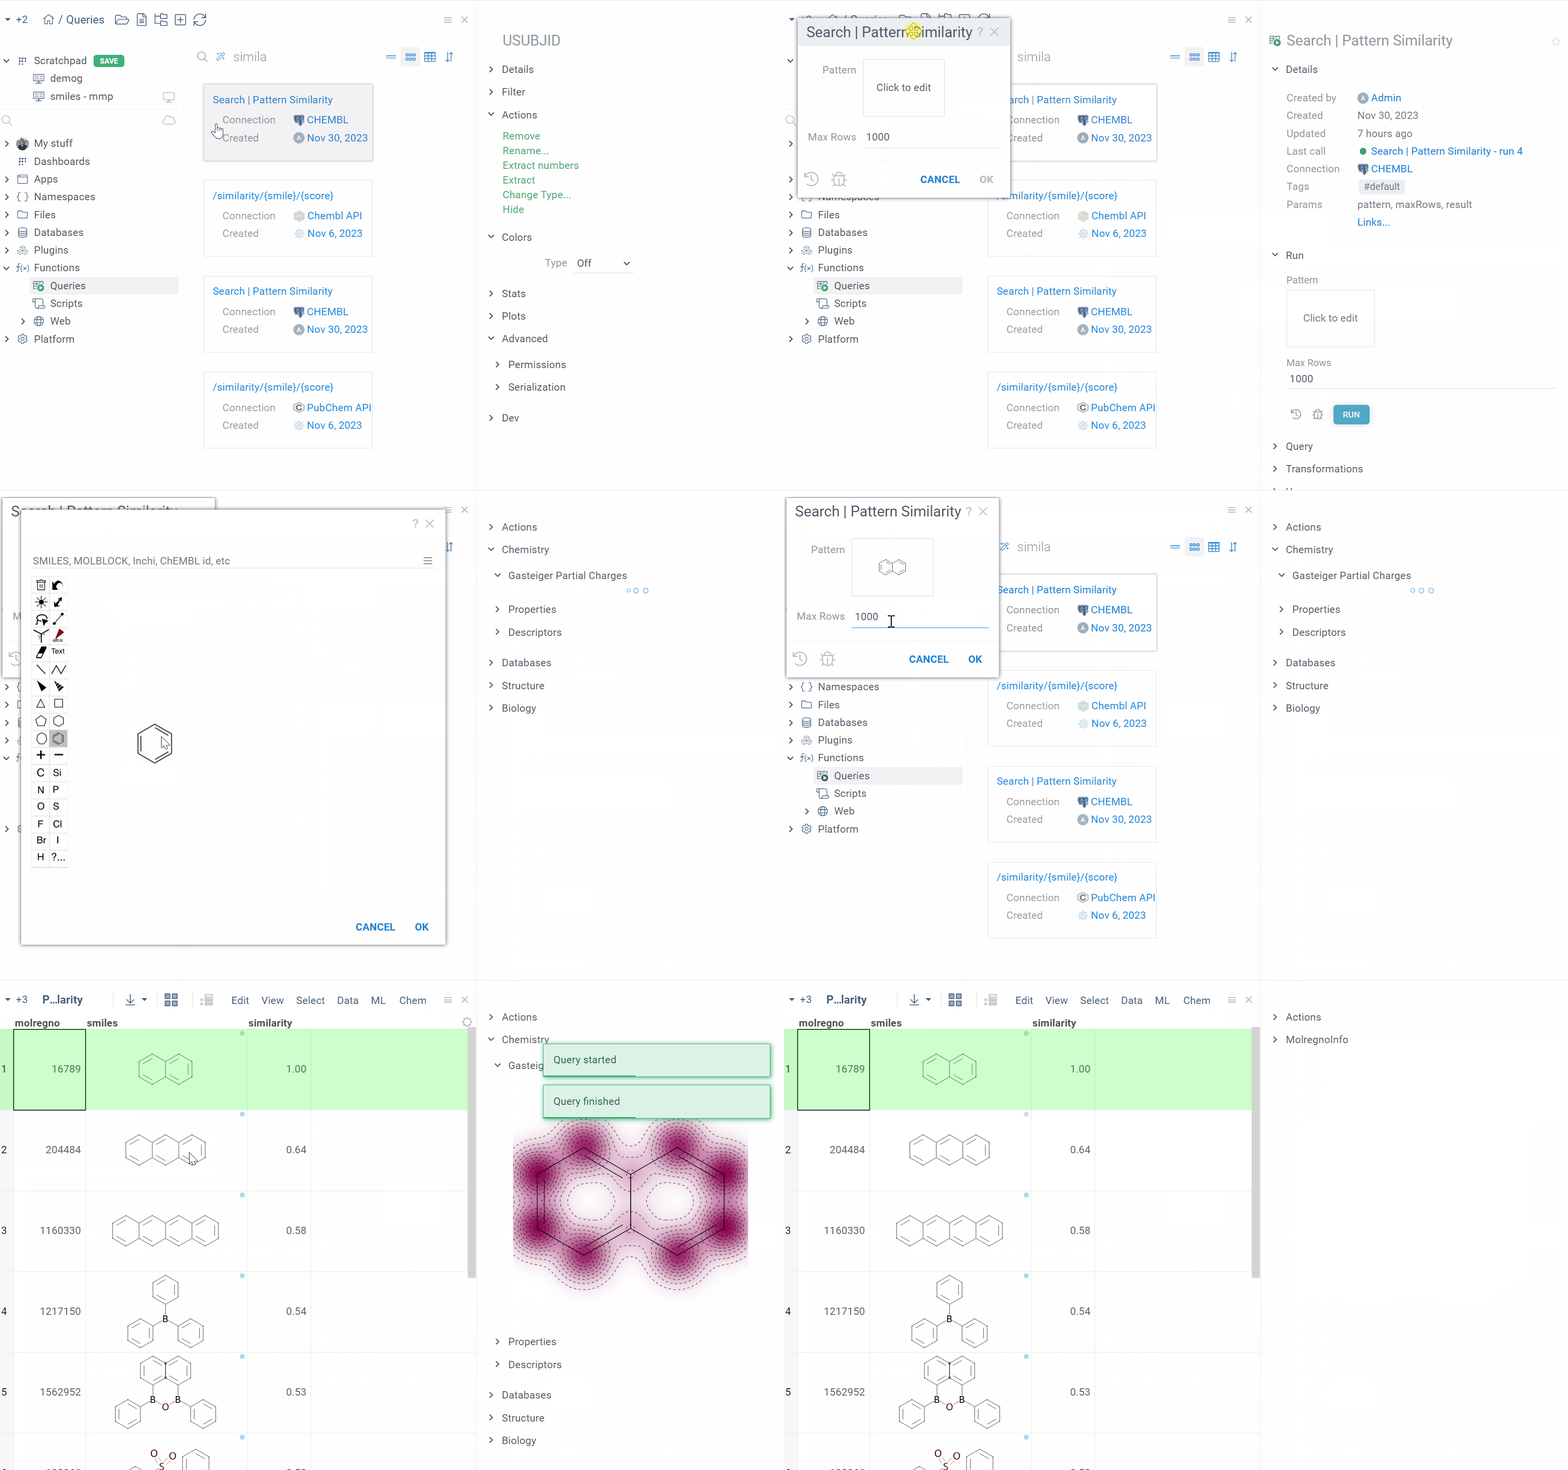
In this example, a query executes a similarity search on the ChEMBL database. When you click the query, it shows the Run info pane with a sketcher for drawing query molecules. As you sketch, the info panes update dynamically to show details about your substructure. Once the query runs, it opens a table with matching structures.
What gets shown and when?
Info panes are displayed based on specific conditions:
- user
- dataset
- context
- user preferences
These conditions are defined using GrokScript, allowing the use of various functions and operators. When the current object changes, the conditions of all registered info panes are checked against the specified parameters, and matching info panes are displayed accordingly.
User condition
You can control access to specific types of info panes based on user attributes such as roles, groups, etc. This condition can be set directly within the script or externally through global permissions.
Code snippet
To set the user condition in a script, use the user variable like this:
# condition: user.name == "john doe" || user.name == "jack smith"
# condition: user.hasrole("chemist")
# condition: user.inteam("high-throughput screening")
Dataset condition
Certain info panes are only relevant when applied to data retrieved from specific data sources. You can define the dataset condition to specify the data source for the table.
Code snippet
To set the dataset condition in a script, use the table variable like this:
# condition: table.gettag("database") == "northwind"
Context condition
Info panes accept only one input parameter, which can be a column, a table, a table cell, or any other object. A condition may check against that object using the parameter name ("x" in a sample code snippet below).
Code snippet
#input: column x
#condition: x.isnumerical && x.name == "f3" && x.stats.missingvaluecount > 0
User preferences
Subject to your permissions, you can control the display of an info pane from the UI. To hide a specific info pane, click the Gear icon on the pane header, then click Do not show. To manage hidden panes, on the Sidebar, click Settings > Panels, and add or remove hidden columns from there.
Default info panes for tabular data
When working with the grid, the default info panes are:
| Table, Column, Row, Selection, Current object | ActionsLists available actions (subject to permissions) |
| Table, Column | DevProvides access to documentation, class references, and code snippets for the current object. It also has an editor with template scripts for common actions related to the objectLearn more |
| Table | GeneralShows basic metadata, such as number of rows, columns, source, etc. |
| Table | ColumnsShows all table columns as clickable links, enabling navigation to individual column info panes |
| Table | ModelsShows relevant models for your dataset (created by you or shared by others). From here, you can manage or train models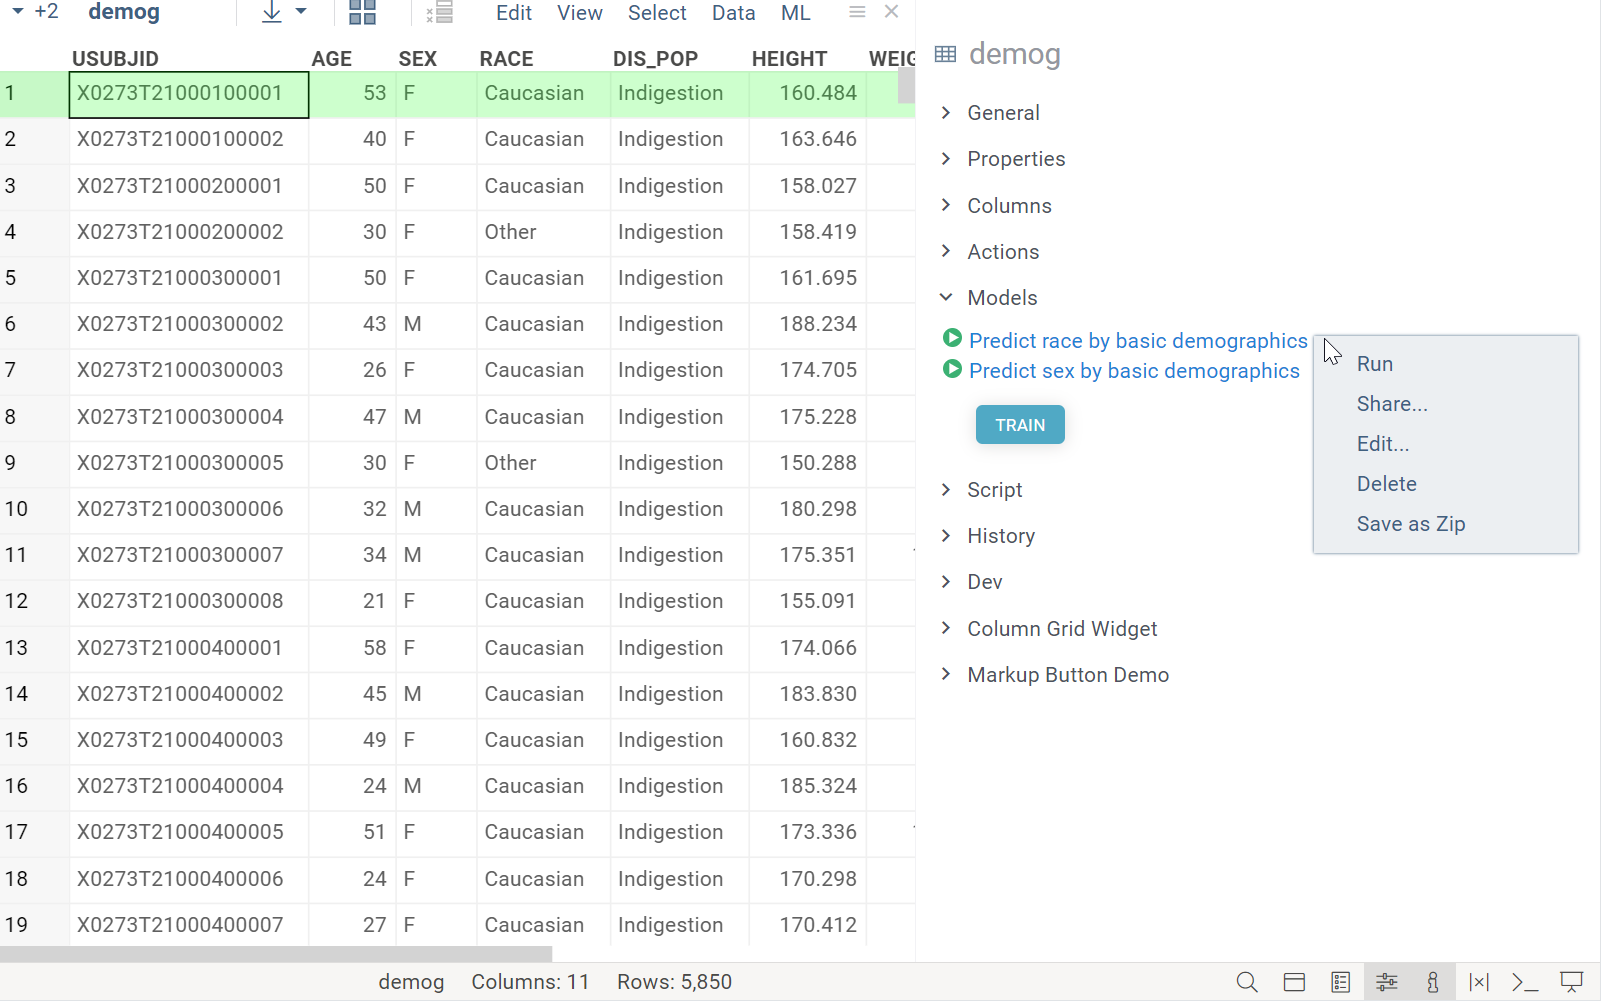 |
| Table | HistoryShows the history of actions performed on the table |
| Column | DetailsShows column properties and summary statistics or distributions for the column's data |
| Column | FilterQuick access to a column's filter |
| Column | ColorsColor code a column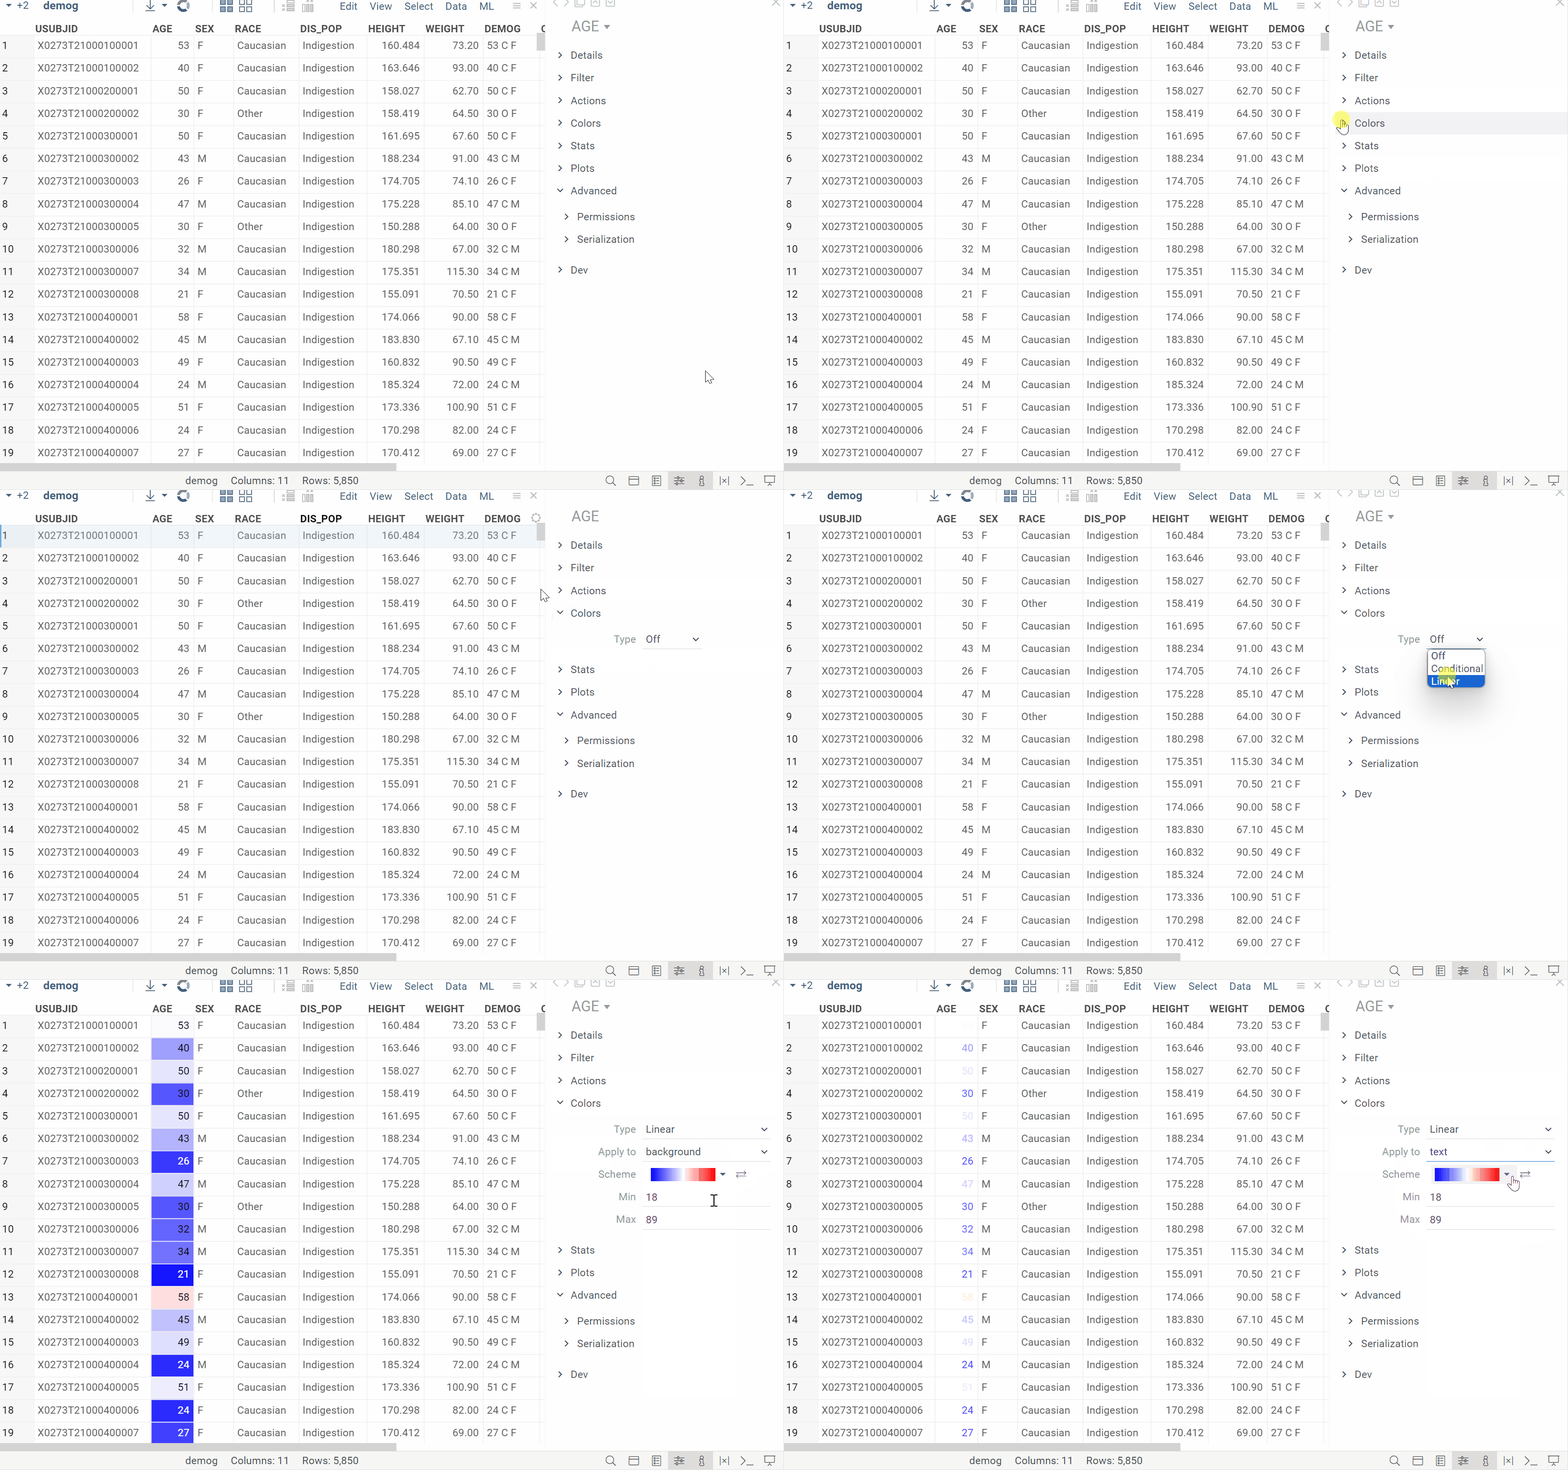 |
| Column | StatsShows summary statistics for a column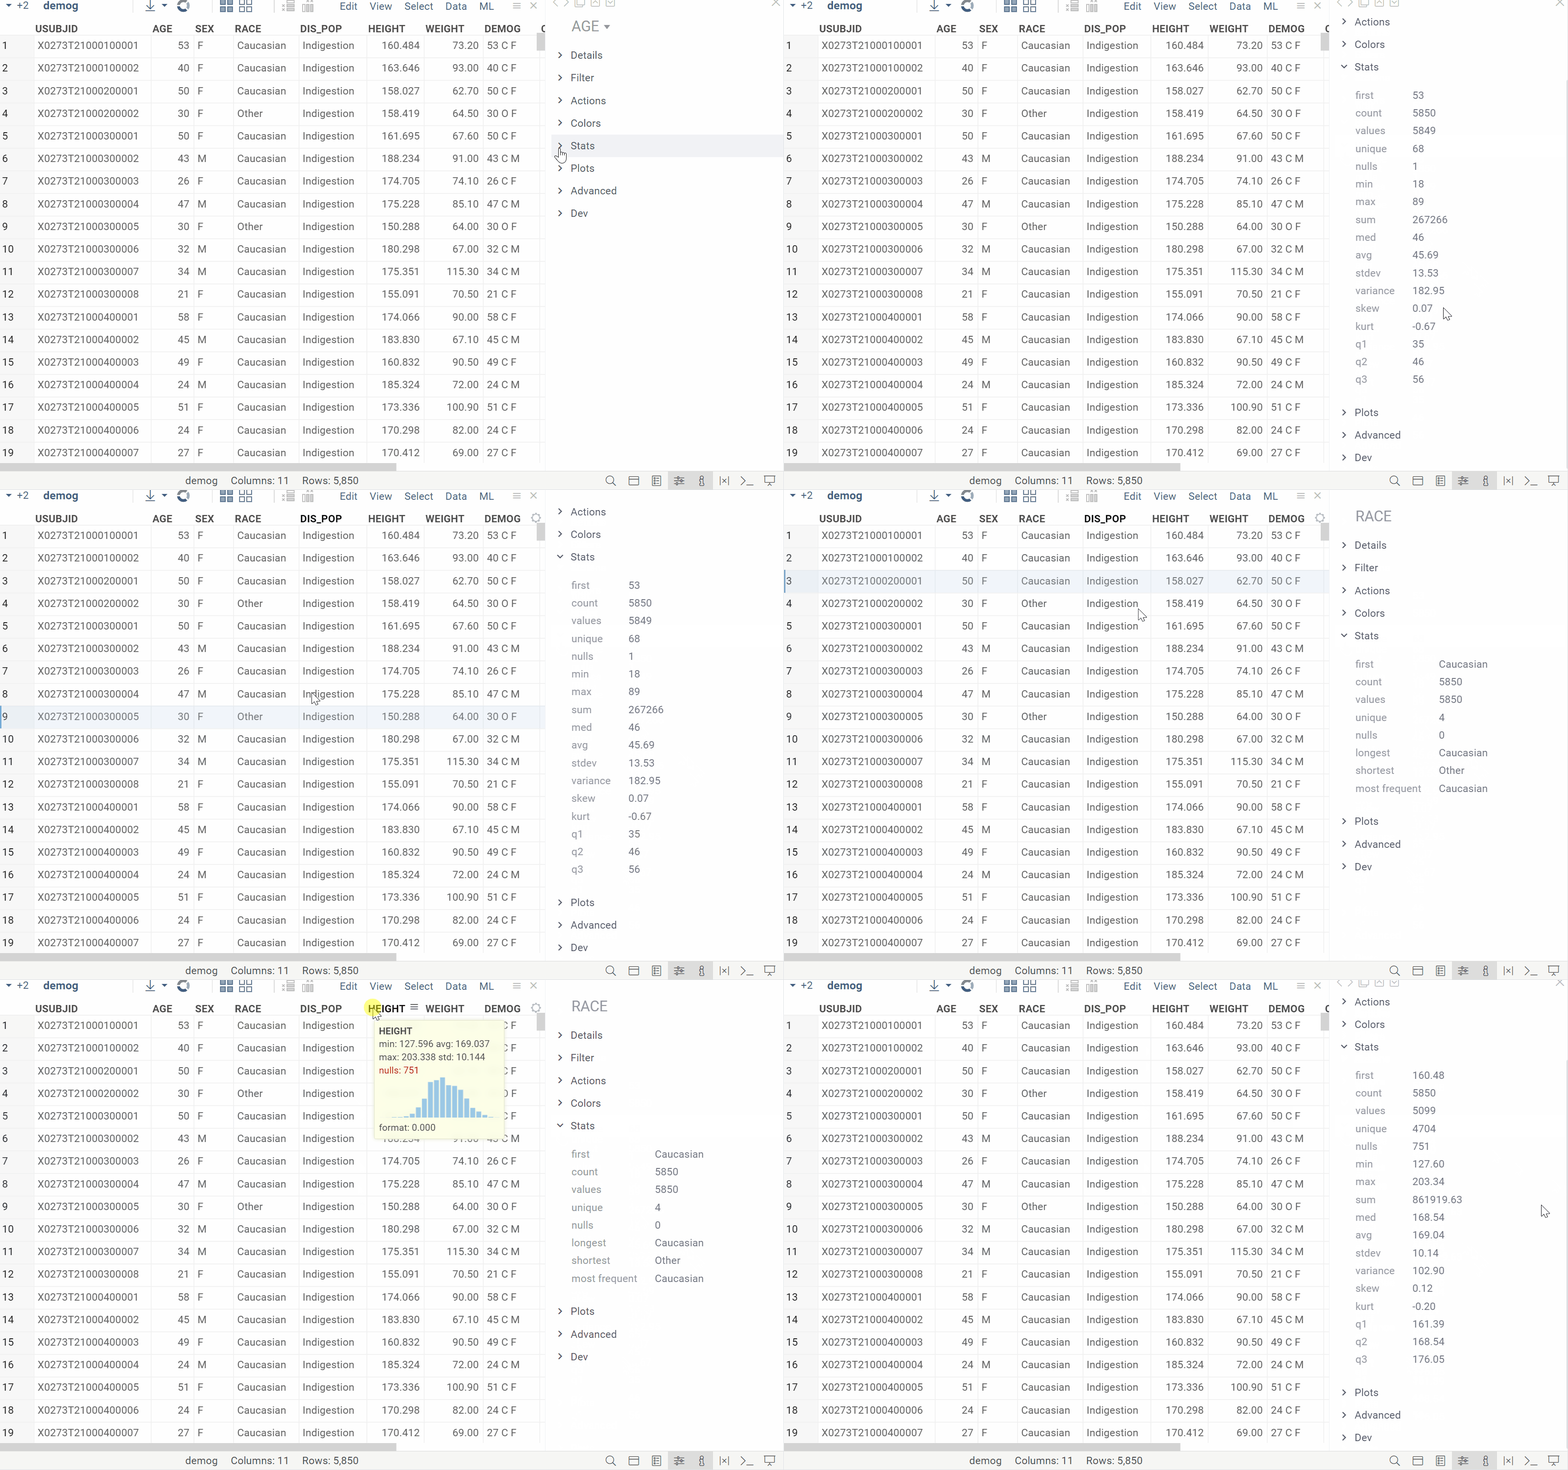 |
| Column | PermissionsSpecify who can edit a column |
| Selected columns | PlotsVisualizes selected columns for quick profiling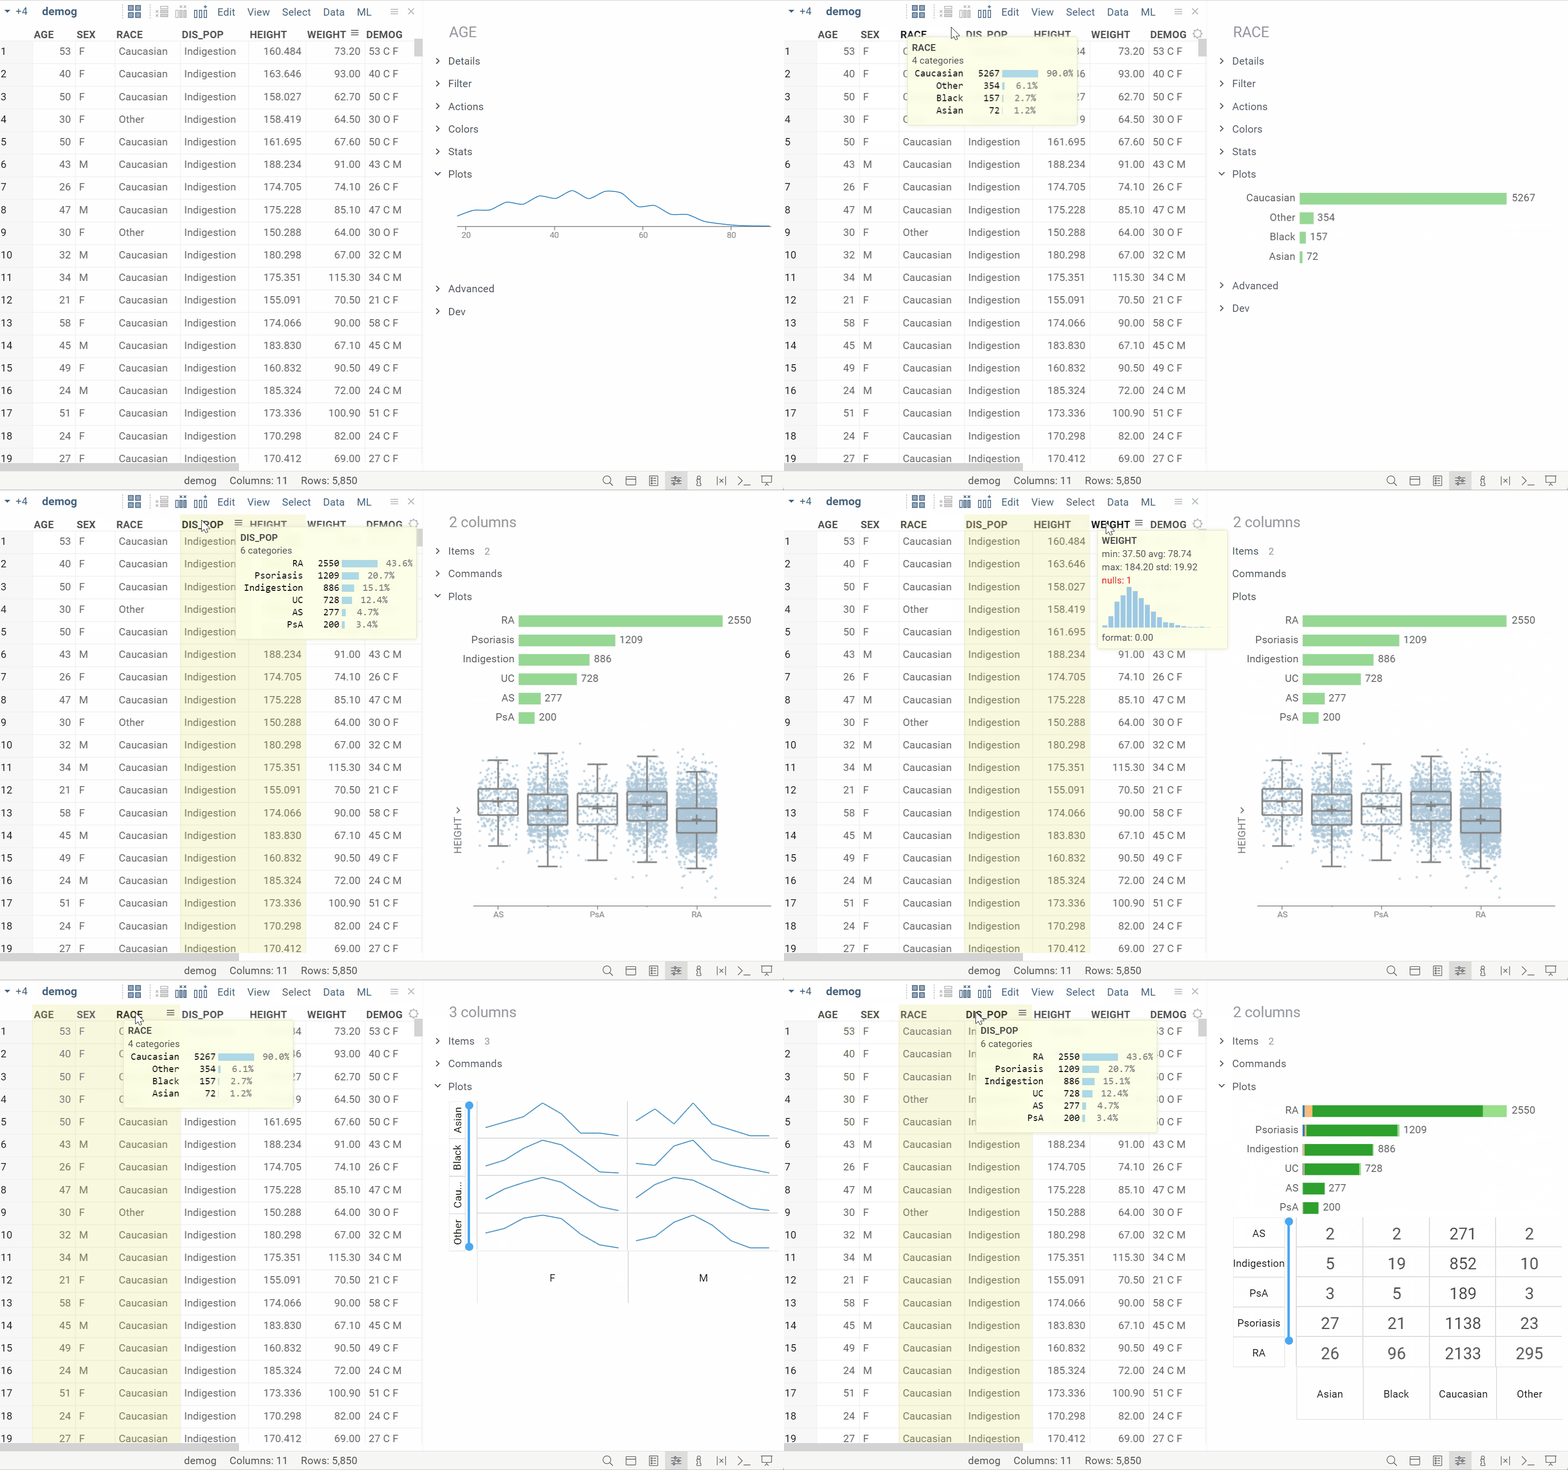 |
| Selected rows | DistributionsShows distributions for numerical columns based on selected rows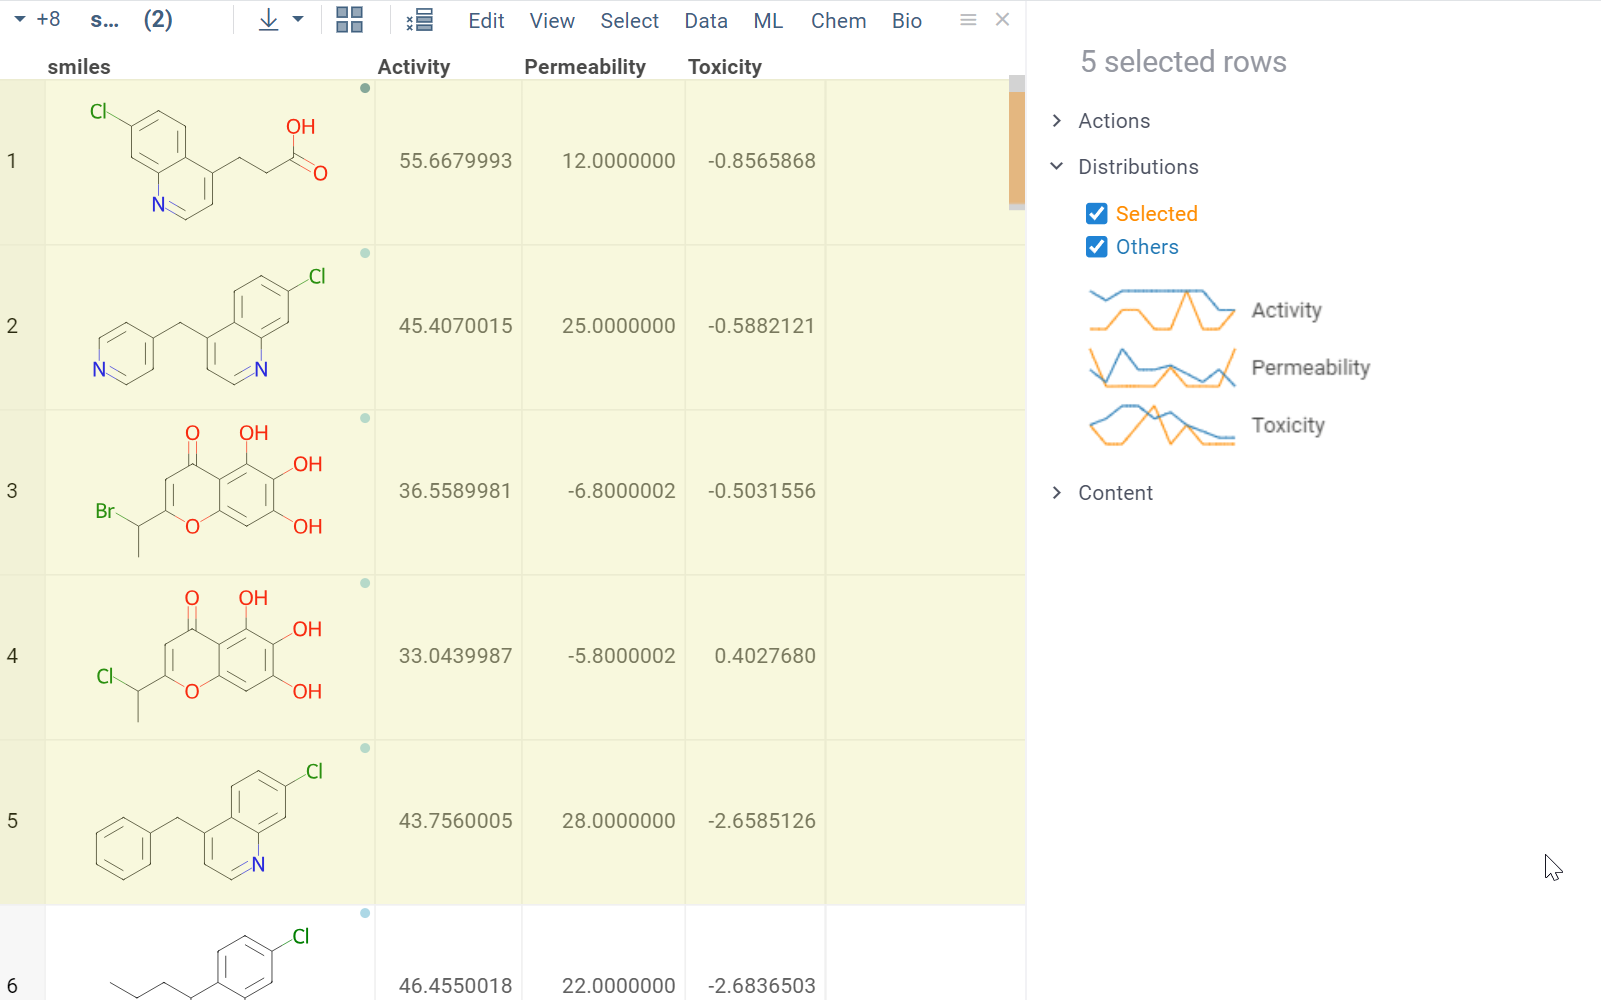 |
| Selected rows | ContentShows details for selected rows in a spreadsheet format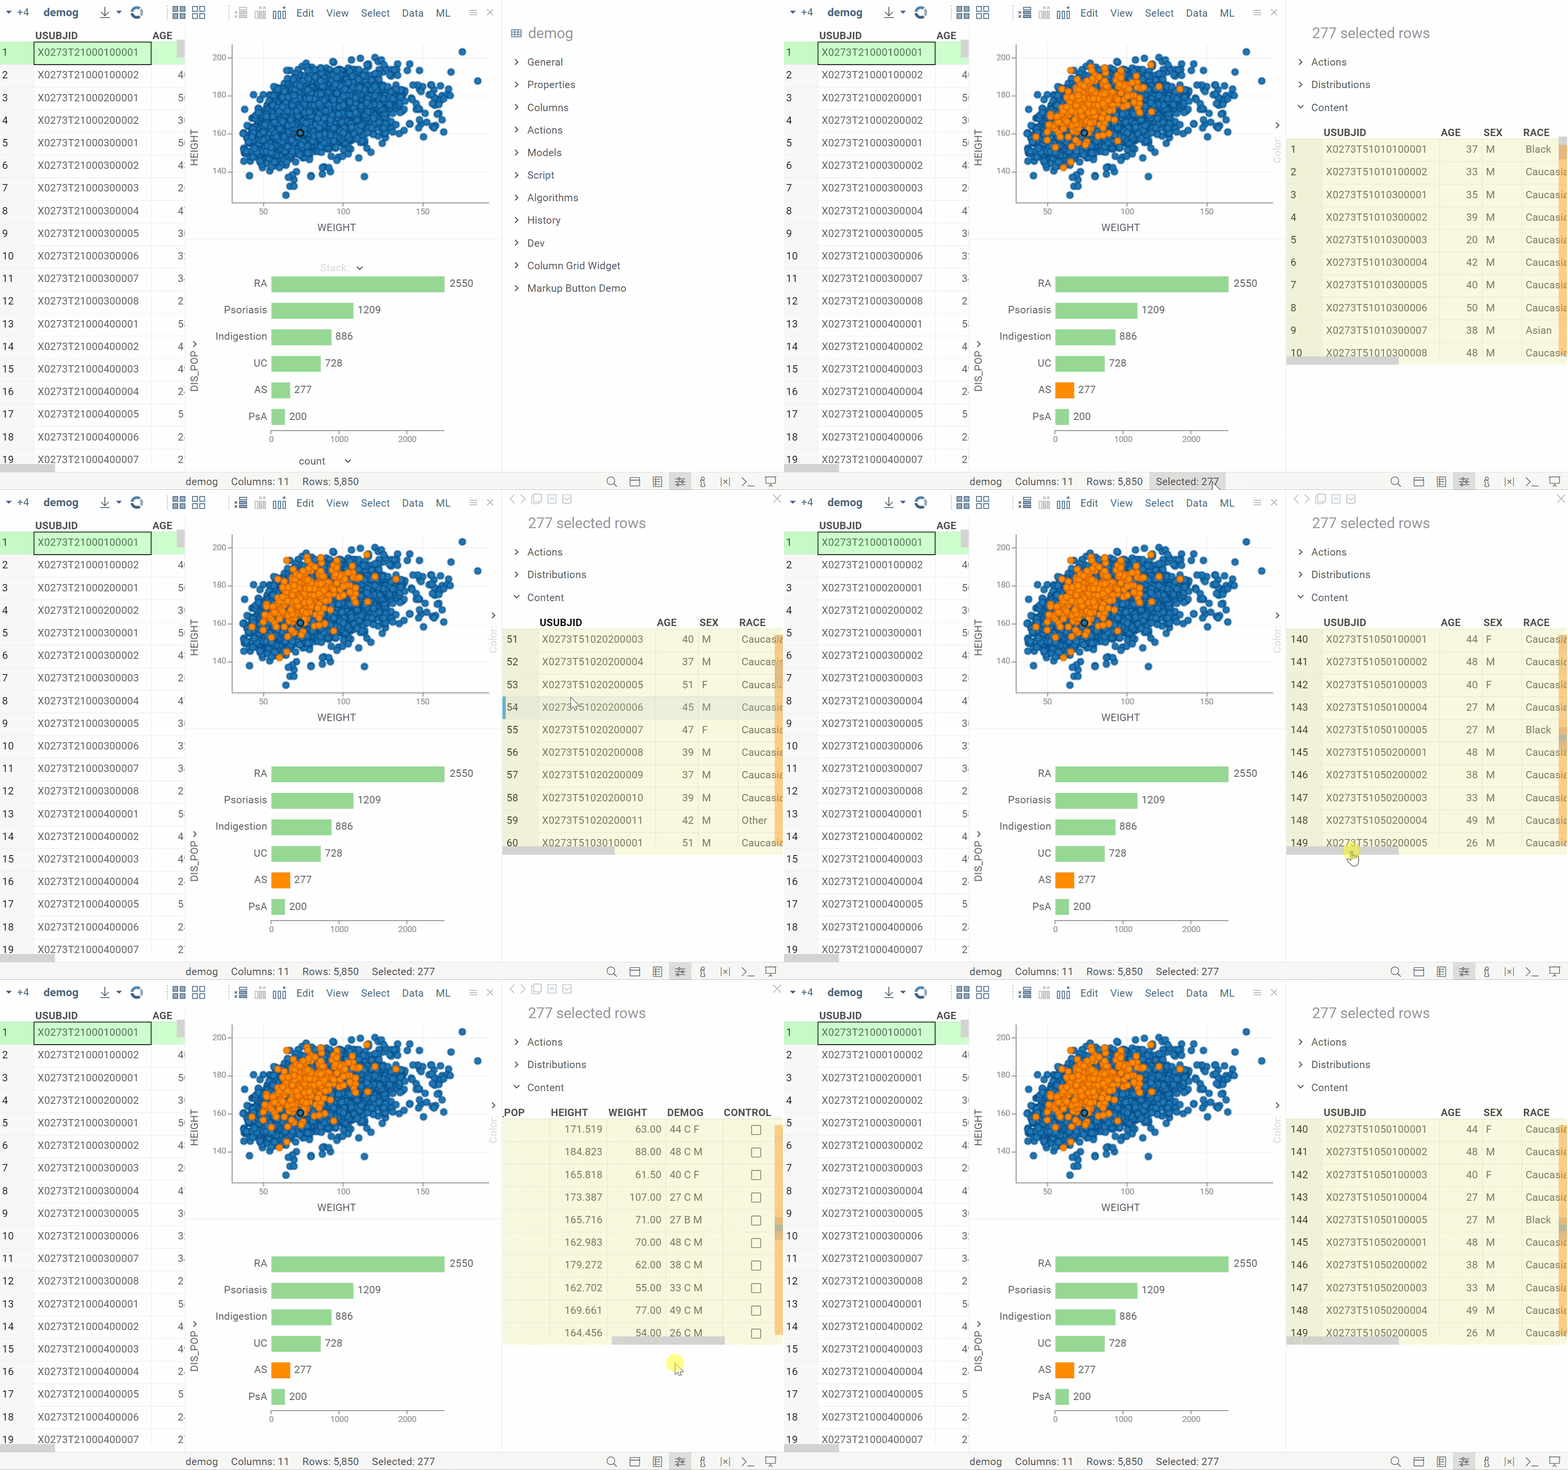 |
Certain grid info panes are provided with the PowerGrid package, which is recommended for installation.
In addition, domain-specific info panes are available in specialized packages, such as the cheminformatics info panes from the Chem package.