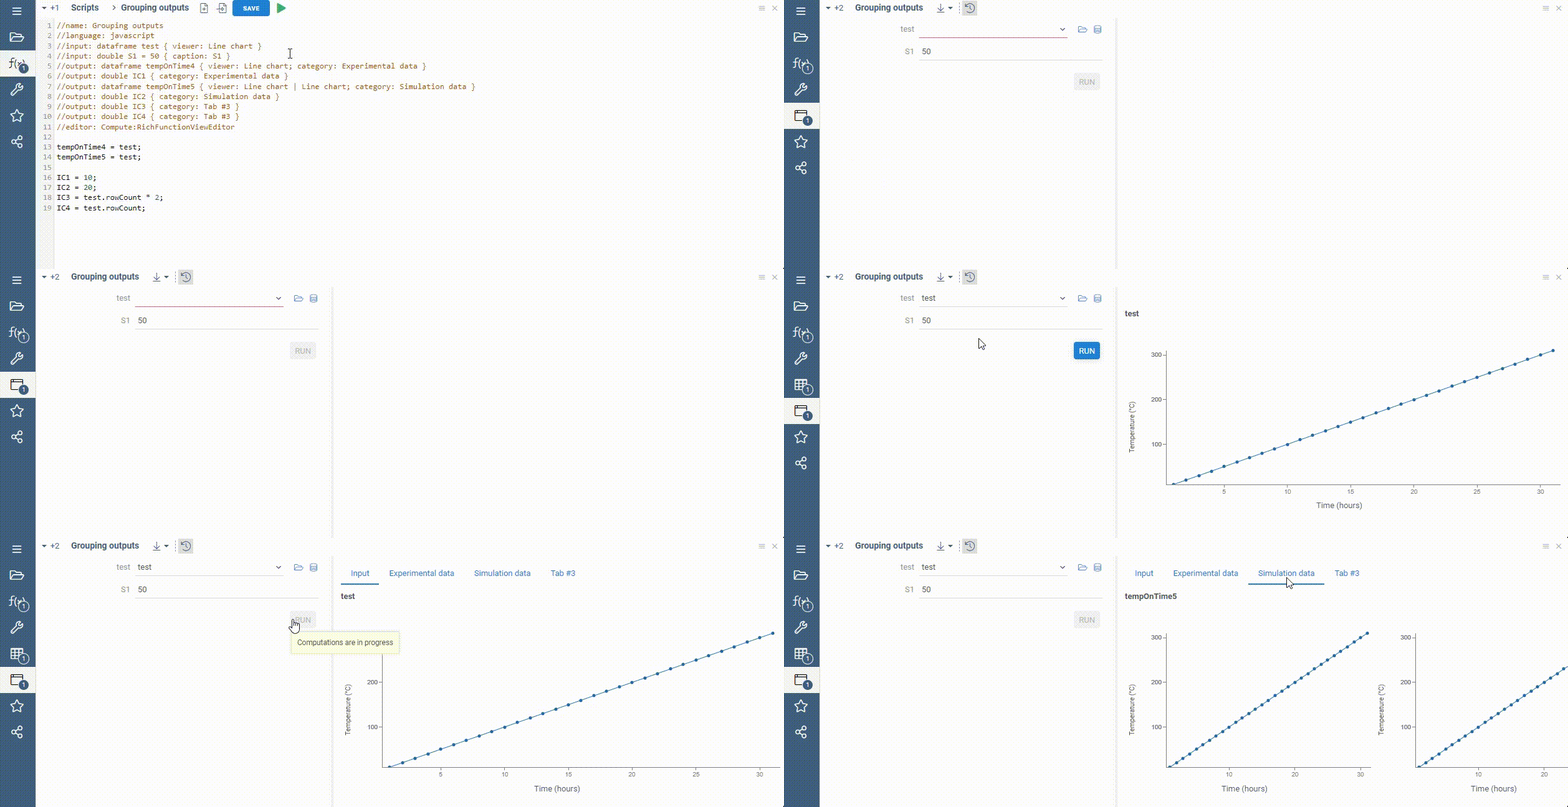
Group outputs
You can use the category keyword to group output parameters,
similar to the input categories.
In the case of output parameters, the category tag specifies
the output tab used to show the output parameter values.
The following code generates UI with three output tabs:
- Result
- Short sample
- Full sample

tip
The view includes 4 tabs in total since there is a separate tab for input dataframe viewers.
Your script header
//output: dataframe tempOnTime4 { viewer: Line chart; category: Experimental data }
//output: dataframe tempOnTime5 { viewer: Line chart | Line chart; category: Simulation data }
//output: double IC3 { category: Tab #3}
//output: double IC4 { category: Tab #3}
https://public.datagrok.ai/scripts
//name: Grouping outputs
//language: javascript
//input: dataframe test { viewer: Line chart }
//input: double S1 = 50 { caption: S1 }
//output: dataframe tempOnTime4 { viewer: Line chart; category: Experimental data }
//output: double IC1 { category: Experimental data }
//output: dataframe tempOnTime5 { viewer: Line chart | Line chart; category: Simulation data }
//output: double IC2 { category: Simulation data }
//output: double IC3 { category: Tab #3 }
//output: double IC4 { category: Tab #3 }
//editor: Compute:RichFunctionViewEditor

tempOnTime4 = test;
tempOnTime5 = test;

IC1 = 10;
IC2 = 20;
IC3 = test.rowCount * 2;
IC4 = test.rowCount;