Debug a script
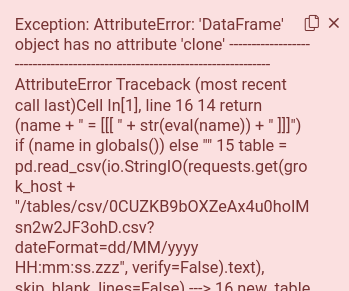
When you run a script, Datagrok catches all log messages and displays it in the log panel below the script. If the script throws an unhandled exception, Datagrok catches it and displays an error popup (shown on the right).
To include additional debug information in the log, run the script using Debug script button in the ribbon menu.
Alternatively, run the script normally and press the Debug button on the bottom part of the input parameter window.

For big and complicated scripts, we recommend you develop them locally in your IDE, and then integrate them into Datagrok.