Customize viewers
Each viewer has a list of customizable properties. They control how the viewer is rendered and how it behaves. For instance, you may specify the dataframe column used as the X-axis on the scatter plot.
The list of available properties differs for each type of viewer.
You may right-click on the viewer and select Properties item in the context menu.
In the viewer tag, you can specify any property listed in the opened property panel.
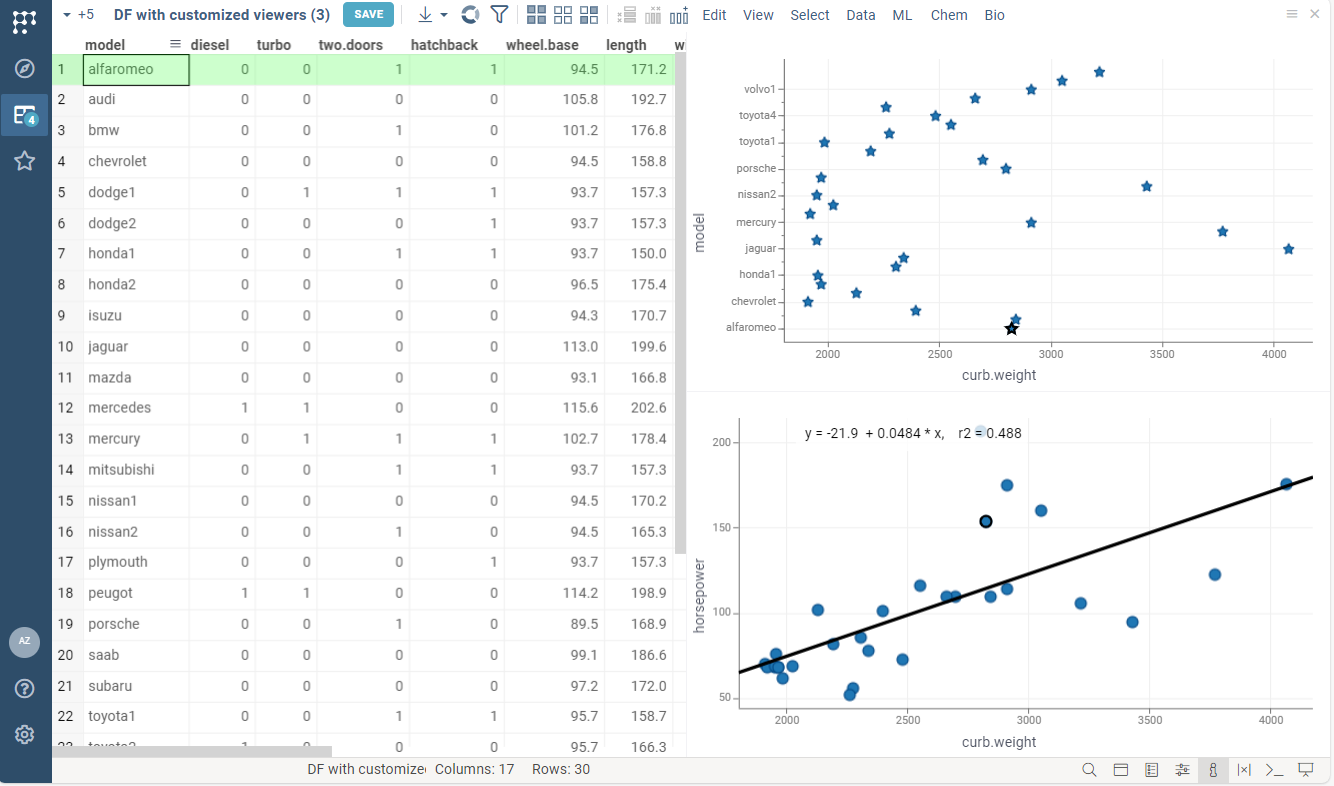
For example, the following code:
- specifies marker type and size for linechart
- enables regression line rendering for scatterplot
only camelCase is accepted
You should enter the viewer property in camelCase format.
For example, here "Show regression line" property
of the scatterplot becomes showRegressionLine.
- Result
- Code
//name: Viewers customization
//language: javascript
//sample: cars.csv
//input: dataframe inputDF
//output: dataframe outputDF { viewer: Scatter plot(y: "model", markerType: star, markerSize: 15) | Scatter plot(showRegressionLine: true) }

outputDF = inputDF
outputDF.name = "DF with customized viewers"
More customization
The default script view shows all viewers at once. You may divide viewers by different tabs using advanced UI editor.