Databases
Datagrok can connect to most relational databases (30+ databases supported), enabling you to do the following:
- Browse databases schemas, tables, and columns.
- Create and edit queries visually.
- Query databases using parameterized queries.
- Use query as a dynamically refreshed data source for dashboards.
- Share connections and queries with others.
- Configure user privileges.
- Create data pipelines.
Connecting to database
Adding connection
To add a new connection, follow these steps:
- Go to Data > Databases.
- In the Database Manager, right-click the desired connector and select Add connection… to open the Add new connection dialog.
- Fill in the connection parameters.
- Click TEST to test the connection, then click OK to save it. If the connection fails, verify your connection details and that you added Datagrok's IP addresses to your allowlist.
Ensure your database is accessible from the Datagrok server, as the connection originates from there.
Some connection parameters have unique characteristics, and it's important to specify them correctly:
- JDBC connection. For connections that support JDBC, you can use the
Conn. stringparameter to enter a custom JDBC connection string. Leave all other parameter fields empty. You still need to enter credentials. - Credentials. You have two ways to specify credentials:
-
Manually. When entered manually, Datagrok stores secrets in a secure privilege management system. To specify who can change the connection credentials, click the Gear icon and select from the Credential owner dropdown.
-
Use the Secrets Manager, such as the AWS or GCP Secrets Manager.
-
Upon successful connection, the database appears in the Database Manager under the respective data source. By expanding the database, you can view its saved queries. If connectors support it, you can also inspect the schemas, tables, and columns of relational databases.
Like other objects in Datagrok, newly created connections are only visible to the user who created them. To let others access the connection, you must share it (right-click the connection and select Share... from the list of options).
Caching data
You can cache query results to improve query performance. To learn more, see Caching function results
Modifying connection
To modify a connection, right-click it and select Edit... from the list of options. To quickly create a connection similar to an existing one, right-click it and select Clone...
Database Manager
Database Manager lets you browse database schemas and other objects, such as queries, tables, and table columns (if supported by the providers). You can perform various operations like adding new connections and queries, previewing data, running queries, and managing objects using context actions that are accessible through right-clicking an object. If you don't see a certain action, it may be due to insufficient permissions. Contact your Datagrok administrator for assistance.
The Context Panel, which is located to the right of the Database Manager, helps you work with database objects. Whenever you click an object within the Database Manager, the Context Panel displays the object's properties and context actions. For example, when you click a table, the Context Panel lets you view the table's metadata, dynamically preview the table's contents, run queries, and access other relevant information and options. To learn more about the Context Panel, see Context Panel.
Context Panel can be extended. You can add custom info panes and context actions.
Schema Browser
The Schema Browser helps you explore all tables and columns belonging to a connection. To open a Schema Browser, in the Database Manager right-click a connection and select Browse schema.
Similar to the Database Manager, clicking an object in the Schema Browser updates the Context Panel with object-specific properties and actions. To open the object's context menu, right-click it.
Viewing schema as dataframe
Another way to explore a database schema is through an interactive spreadsheet. To access this feature, in the Database Manager, right-click a connection and select Open schema as table.
Working with queries
Datagrok provides several tools for creating, exploring, and editing queries.
-
Editors:
- Query Editor is the main interface for executing database queries. Using this tool, you can write and edit statements in SQL and other languages and use functions to add post-processing steps.
- Visual Query Editor can be used for manipulating, summarizing, filtering, and pivoting table data.
-
Built-in queries for tables:
- Get All: retrieves all table data. Use it with caution.
- Get TOP 100: retrieves the first 100 rows.
tipTo retrieve specific columns, hold down the Shift key on your keyboard while clicking the desired columns in the schema. Once selected, right-click the selection and run Get All or Get TOP 100 just for these columns.
-
AI Query Builder: lets users build queries using natural language. To access AI Query Builder, install the Grokky plugin.
When you successfully create a query, it appears in the Database Manager under the corresponding connection or table. From there, you can run it, share it with others, manage access, and perform other tasks.
To see all queries belonging to a connection, right-click it and select Browse queries from the list of options.
Query Editor
Query Editor is the main interface for executing database queries. To open it, right-click a database connection or a table and select New Query... (for connections) or New SQL Query... (for tables).
The Query Editor has the following tabs:
- Query
- Transformations
- Post-Process
- Layout
- Debug
This tab is where you write and edit queries. As you work on your query, you can preview the query output at any time by clicking the Run/Refresh button on the menu ribbon or by pressing the F5 key on the keyboard. The query result is displayed in the bottom part of the editor as an interactive dataframe. In the dataframe, you can view object details, perform actions on columns, and more.
When your query is complete, give it a name and click the Save button. If you don't want to save the query, close the editor without saving.
You can also add the query results to the workspace for further analysis. To do so, click the Add (+) icon on the menu ribbon of the Query tab.
Use this tab to apply post-processing operations to your query:
- Select a function to apply to a query. Use checkboxes next to the operation categories to filter.
- Set the function parameters in the dialog that opens.
- Click OK.
- Repeat the steps as needed.
Each transformation is recorded. To see the results of each record, locate the record on the left and click it. The data output for this step is displayed in the Preview section.
You can also edit or remove transformation records as needed. To edit a transformation step, click the Dropdown Arrow control next to the transformation record and select from the list of options. To remove the transformation record entirely, click the Delete (x) icon.
Use the menu ribbon on top to add or remove columns quickly.
You can create custom transformation functions in R, Python, or any other language. See Scripting.
Use this tab to view, edit, and extend the query script in your chosen programming language (R, Python, JavaScript, Octave, Julia, NodeJS, Grok, or Pyodide).
This tab lets you set up a query result’s layout, including arranging viewers, applying color coding, and configuring styles, formatting, and other interface elements.
Once your layout is complete, click Save.
This tab is where you can run queries and monitor their execution logs. Use it to track the query’s execution process and debug issues.
Visual Query Editor
Visual Query Editor is a visual tool for joining tables, selecting columns, and summarizing data with pivoting and grouping. To open it, right-click a table in the Database Manager and select New Visual Query....
The Visual Query Editor has the same tabs—Queries, Transformations, Post-Process, Layout, and Debug—which work similarly to the Query Editor's tabs.
To aggregate data, use the Query tab. Here, you can join multiple tables and choose which columns to include in your report. You can decide how to pivot, group, and sort data. You can show one or multiple aggregated values for rows, for example, average sales and headcount by country. Additionally, you can pivot rows into columns to show one or more aggregated values for each column. You can also perform both actions to produce a pivot table that shows an aggregated value for every intersection of rows and columns.
-
Data: Use this field to select tables and columns for your query. To do so, click the Add a table (⧉) icon, choose the tables, and specify which columns to include in the result.
-
Join: Use this field to define relationships between tables. Tables are added automatically when more than one is selected in Data. By default, they are joined with the left inner join. To change the join type, click the Join tables icon between table names and choose the desired type. To change a key column, click it and select the required one from the list.
-
Where: Use this field to filter the results using the pattern syntax. To do so, click the Add (+) icon, select the column to which you want to apply the filter, then set the condition (see parameter patterns for syntax). You can also make the Where condition a UI input parameter by selecting the checkbox located just before the expression.
-
Group by: Use this field to specify columns to be used for grouping rows. To do so, click the Add (+) icon and select the desired column from the list. The chosen column then acts as a key, with its unique values serving as row identifiers. You can add multiple columns.
-
Aggregate: Use this field to add aggregated values. First, click the Add (+) icon and select the column you want to aggregate. Datagrok automatically applies a default aggregating function based on the data type: average for numerical data and count for categorical data. To change the aggregating function, right-click the column, select Aggregation, and choose your preferred function from the list. Each column can only have one aggregating function, but you can add multiple columns or the same column with different aggregating functions.
noteIf you add columns only to the Aggregation field without adding any columns to the Group by or Pivot fields, the resulting query returns a single row that shows the total aggregate values for each column added in the Aggregation field.
-
Pivot: Use this field to specify the rows that you want to show as columns. To do so, click the Add (+) icon and select the desired column from the list. You can pivot one or more columns.
-
Order by: Use this field to sort query results. Click the Add (+) icon and select one or more columns from the list of the group by columns. Click the Sorting Order (↑) icon to change the order.
As you work on your query, you can preview the query output as an interactive dataframe. In the dataframe, you can view object details, perform actions on columns, and more. When your query is complete, give it a name and click the Save button. If you don't want to save the query, close the editor without saving.
AI Query Builder
AI Query Builder lets you ask questions in natural language and
generates database queries. You can then continue working with the query in
the Query Editor — manually edit, debug, add layouts, and more.
To open the AI panel, click the AI icon on the menu ribbon of the Query tab. In the AI panel, use the conversational style to create or modify your query. For instance, you might start with "Give me the identifiers of molecules active against the target X" and then, after the AI builds and executes the query, continue with "Include chemical structures as well".
Parameterized queries
In Datagrok, queries are functions. Like with JavaScript functions, you can add
metadata to a Datagrok function at the function level or the parameter level.
This metadata can include things like the function's name, connection details,
caching options, and more. At the parameter level, you can specify metadata such
as the parameter's name as it should appear in the user interface, its semantic
type, input type, and so on. To define query parameters, use SQL/Sparql comments
in the query header : -- for SQL, and # for Sparql. The syntax for defining
query parameters is based on
scripting, with
additions specific to queries.
When you want a query to ask for input every time you run it, you can create a parameterized query. This type of query relies on one or more parameters, which are placeholders for input values. When you run a parameterized query, Datagrok autogenerates a parameter dialog, prompting you to enter the relevant parameter values. By doing so, you can use the same query to retrieve data that matches different criteria.
Query parameters
The syntax for defining query parameters is based on functions syntax with additions specific to queries.
Queries have a special connection parameter corresponding to the query
connection name. It is optional, just like the rest of parameters.
Another addition is the list<T> parameter type. It denotes a list of objects
of type T. Currently only strings are supported. You can add an input/output
of type list<string>.
Add a parameter
-
Right-click a query and select Edit. A Query View opens.
-
In the Query tab, annotate parameters in the box provided using SQL/Sparql comments. Use
--for SQL and#for Sparql.Example:
--input: string productNameselect * from products where productname = @productName -
Click Save.
Input parameters
To define input parameters for your SQL query, use the --input annotation
followed by the parameter's data type, name, default value, and any additional
options. You can also include a brief description of the parameter that will
appear in the UI:
--input: <type> <name> = <initialValue> {<option>: <value>; ...} [<description>]
Supported parameter types include integer, double, boolean, string,
DateTime, and list<T> (a list of parameter type T, currently supports the
strings type only). Additional options are
based on the parameter type, and may include choices, suggestions, and
validators.
For example, this is an optional string parameter "shipCountry" with the initial value "France" (learn more about initial values and optional parameters):
--input: string shipCountry = "France" { nullable: true }
SELECT * FROM customers where shipCountry = @country
You can also use lists to pass multiple values for a single parameter. For
example, you can use lists to retrieve data for a specific set of users or
analyze sales data for a particular country. To use lists in queries, you can
specify list<T> as the parameter's data type and wrap its use inside the SQL
query into = ANY(p), or a similar operator with an alternative selection of
the comparison type, such as >= ANY or < ANY. Here's an example:
--input: list<string> shipCountry = ['France', 'Italy', 'Germany']
SELECT * FROM Orders WHERE shipCountry = ANY(@shipCountry)
This query returns all records from the Orders table where the shipCountry
column matches any of the values in the shipCountry list.
To help you use queries more quickly and accurately, use choices, suggestions, and validators. Choices allow users to select from a predefined list of values for a given parameter, suggestions provide users with auto-complete suggestions based on what they type in the input field, and query validators validate the query without executing it.
You can define choices using a comma-separated list of values, a name of another query, or by writing an actual SQL query. Here's an example of how to define choices for a ship country input parameter using all three methods:
--input: string shipCountry = "France" {choices: ['France', 'Italy', 'Germany']}
--input: string shipCountry = "France" {choices: Demo:northwind:countries}
--input: string shipCountry = "France" {choices: Query("SELECT DISTINCT shipCountry FROM Orders")}
Parameter's choices, validators, and suggestions can depend on the value of
another parameter. This is useful when creating queries with hierarchical
choices, where each subsequent parameter depends on the previous one. To do
this, specify the input parameter you want to reuse and its default value, if
applicable. Then, define the choices query using the Query() function and
reference the input parameter using the @ symbol.
Here's an example
--input: string state = "NY" {choices: Query("SELECT DISTINCT state FROM public.starbucks_us")}
--input: string city = "Albany" {choices: Query("SELECT DISTINCT city FROM public.starbucks_us WHERE state = @state")}
SELECT * FROM public.starbucks_us WHERE (city = @city)
Here, the state and city parameters are defined as strings with default
values. The city parameter's choices query references the state parameter
using @state. This ensures that the choices are filtered based on the value of
state.
To define suggestions or validators, provide the name of the function that will be executed to generate suggestions or validators as the user types a value.
A special query input type is a filter pattern that allows you to enter free-text conditions like "this week" for dates, or ">50" for numbers.
Output parameters
Output parameters define how the query output is presented. By default, a
query's result is returned as a dataframe. You can specify a different data type
in the output parameter. The following types are supported: int, float,
string, bool, map. Here's an example from the
Chembl
package, where the query returns a string of the semantic type Molecule:
--output: string smiles {semType: Molecule}
Running queries
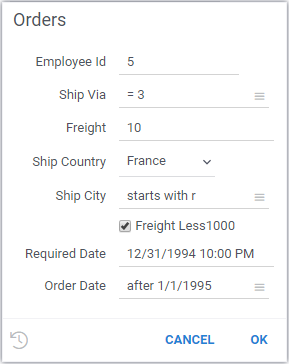
To run a query, locate the query in the Database Manager and double-click it. For parameterized queries, Datagrok automatically generates a parameter dialog that prompts you to enter values for the input parameters. The input parameters are then substituted for inputs from the UI controls, allowing you to create complex queries with dynamic choices that are easy to use and maintain.
Here's an example of a parameterized query with several input parameters and options:
- Parameterized query
- Parameter dialog
--input: int employeeId = 5
--input: string shipVia = "=3" {pattern: int}
--input: double freight = 10.0
--input: string shipCountry = "France" {choices: Query("SELECT DISTINCT shipCountry FROM Orders")}
--input: string shipCity = "starts with r" {pattern: string}
--input: bool freightLess1000 = true
--input: datetime requiredDate = "1/1/1995"
--input: string orderDate = "after 1/1/1995" {pattern: datetime}
SELECT * FROM Orders WHERE (employeeId = @employeeId)
    AND (freight >= @freight)
    AND @shipVia(shipVia)
    AND ((freight < 1000) OR NOT @freightLess1000)
    AND (shipCountry = @shipCountry)
    AND @shipCity(shipCity)
    AND @orderDate(orderDate)
    AND (requiredDate >= @requiredDate)
To run a query programmatically, see this code snippet. Learn how to expose the parameter dialog to end-users as an application.
After running a query, you typically get back a dataframe. You can perform various operations on this dataframe, such as data cleansing, transformation, and more. All of these actions get recorded as macros, and will be replayed when the query is re-executed. Once you have the data set up to your satisfaction, you can add viewers and create a visualization.
To view the queries you've created or those shared with you, you can use the Queries Gallery (Data > Queries). This gallery provides a convenient interface to quickly access and manage queries. You can search queries by their name or tag and use the Context Panel to view information and actions for the selected query.
Creating dynamic dashboards for query results
You can create and publish dashboards that query data from a database and then present it in a visual layout. For parameterized queries, these dashboards can be dynamic, allowing dashboard users to change the query parameters right inside the dashboard to refine search criteria and interact with data in real-time.
To save the query output as a dynamic dashboard, do the following:
- Run a query to open a dataframe and create a desired view of the query output.
- On the Sidebar, click Projects > Upload.
- In the Upload project dialog, enter a name and description (optional) in the fields provided.
- Select how to store data:
- Save the data as a static snapshot.
- Store the data as a generation script by toggling the Data sync control. The query re-executes each time the project is opened. To learn more about dynamic data updates in projects, see Dynamic data.
- Click OK to upload the project.
- Share the project with others.
Sharing query results
You have two options to share query results in Datagrok:
- Share its URL
- Share it as a project.
Each query output has a unique URL, which has all the information needed to recreate the query, including its parameters. This is especially useful for parameterized queries, where you can embed the query output on external websites with specific parameters applied. After you have executed a query, copy the URL from the address bar and share it with others. When this URL is accessed, a query gets re-executed, so the query output always displays the latest data. When the users open the report, they can still change the query parameters in the Toolbox on the left.
To access the query results from the link provided, users must have the necessary permissions to execute this query.
If you want to persist a specific layout, create a dynamic dashboard, or assign access permissions to specific groups or users, you can share query results as a project. First, you need to upload the project. Then, locate the desired project in Data > Projects and right-click it to share. Users will get an email notification with the access link. To learn more about access privileges, see Access control.
Access control
In Datagrok, certain objects called entities have a set of operations that can be applied to them. These entities are connections, queries, tables, and table columns, all of which can be shared, assigned permissions, annotated, and more.
When you create an entity such as a connection or a query, it's private and visible to you only. To make it accessible to others, you can share it.
To share:
-
Right-click the connection or a query you want to share and select Share....
-
In the Share dialog, enter a user or a group that needs access and set corresponding permissions. These privileges can be given to users or to groups. For more information on the access privilege model, see Permissions.
-
Optional. Add a description in the provided text field. If you don't want to notify the recipients, clear the Send notification checkbox. :::note
If you enter the name of a user or a group, they are notified through the Datagrok interface. To share an object with a user who doesn't have a Datagrok account, enter their email address. They will receive an email notification containing a link to the shared object and the entered description. After they sign up for a Datagrok account, they will be able to access the shared object.
:::
-
Click OK to share.
If you can't share a connection or a query, you may have insufficient permissions. Contact your Datagrok administrator for assistance.
Use the Context Pane on the right to inspect and quickly adjust access permissions to your databases, manage queries, view history and activity details, send comments to those you're sharing with, and more.
Datagrok query belongs to the database connection for which it's created. It means you can't share a query without sharing a connection. Deleting a connection also deletes a query.
Data enrichment
When working with database-linked data (either retrieved directly from the database, or containing the identifiers from that database), a popular need is to "enrich" existing rows in the spreadsheet with certain information from the database. For instance, given a column with SMILES, medicinal chemists might want to quickly access their ADME properties. Datagrok makes it possible to do in one click.
To enrich a dataset, click on a column that was retrieved from the database. On the context panel, expand the pane with the name of the database this column came from (such as "ChEMBL"), and click "Enrich...". In the dialog that appears, choose the columns that should be joined to the source columns. This dialog uses visual query editor that automatically constructs the way columns should be joined, if this can be inferred from the database schema; if not, you can specify joins manually.
You can save the enrichment configuration by giving it a name, and clicking "SAVE". After that, you would see this next to the "Enrich..." button, allowing you to retrieve the necessary data in one click.
You can also publish enrichments with plugins.
Database explorer
The Database Explorer automatically detects company-specific identifiers (such as compound IDs or product codes) in your database. Click any identifier to drill down through related tables and see all associated data.
When you configure the explorer for your database, the system:
- Detects identifiers: Automatically recognizes identifier patterns (e.g.,
CHEMBL1234,DRUG_ID_5678) in your data using regular expressions. - Maps to semantic types: Associates each identifier pattern with a semantic type and links it to a specific column in a specific table within your database.
- Leverages database relationships: Uses the database's foreign key relationships and reference information to understand how tables connect.
- Enables drill-down exploration: When you click an identifier anywhere in Datagrok, the system automatically:
- Queries the database for the entity associated with that identifier
- Displays all related information from the primary table
- Shows all associated records from related tables (using foreign keys)
- Renders custom visualizations (molecules, images, etc.) where applicable
This creates a seamless exploration experience where users can navigate complex database schemas without writing queries or understanding the underlying table relationships.
For detailed instructions on setting up and using the DB-explorer library, refer to the Developers Guide.