Panels
import Tabs from '@theme/Tabs'; import TabItem from '@theme/TabItem';
Panels are supplementary windows alongside your main view such as:
Depending on your needs, you can toggle visibility of any panel from the
Status Bar. To save your panel display preferences, go to Sidebar >
Settings (
Context Panel
Located at the top right hand-side, the Context Panel serves two main functions:
- For visual UI components like viewers
or widgets, it provides
access to settings. To access settings, click the Gear (
) icon in the top right corner of the visual component. - For Datagrok entities and other data objects (e.g., molecules), it shows information and options for your current object. To make an object current, click it. For example, clicking a molecule shows details like its weight or toxicity. Clicking a query shows its associated data connection, SQL code, and parameters for execution.
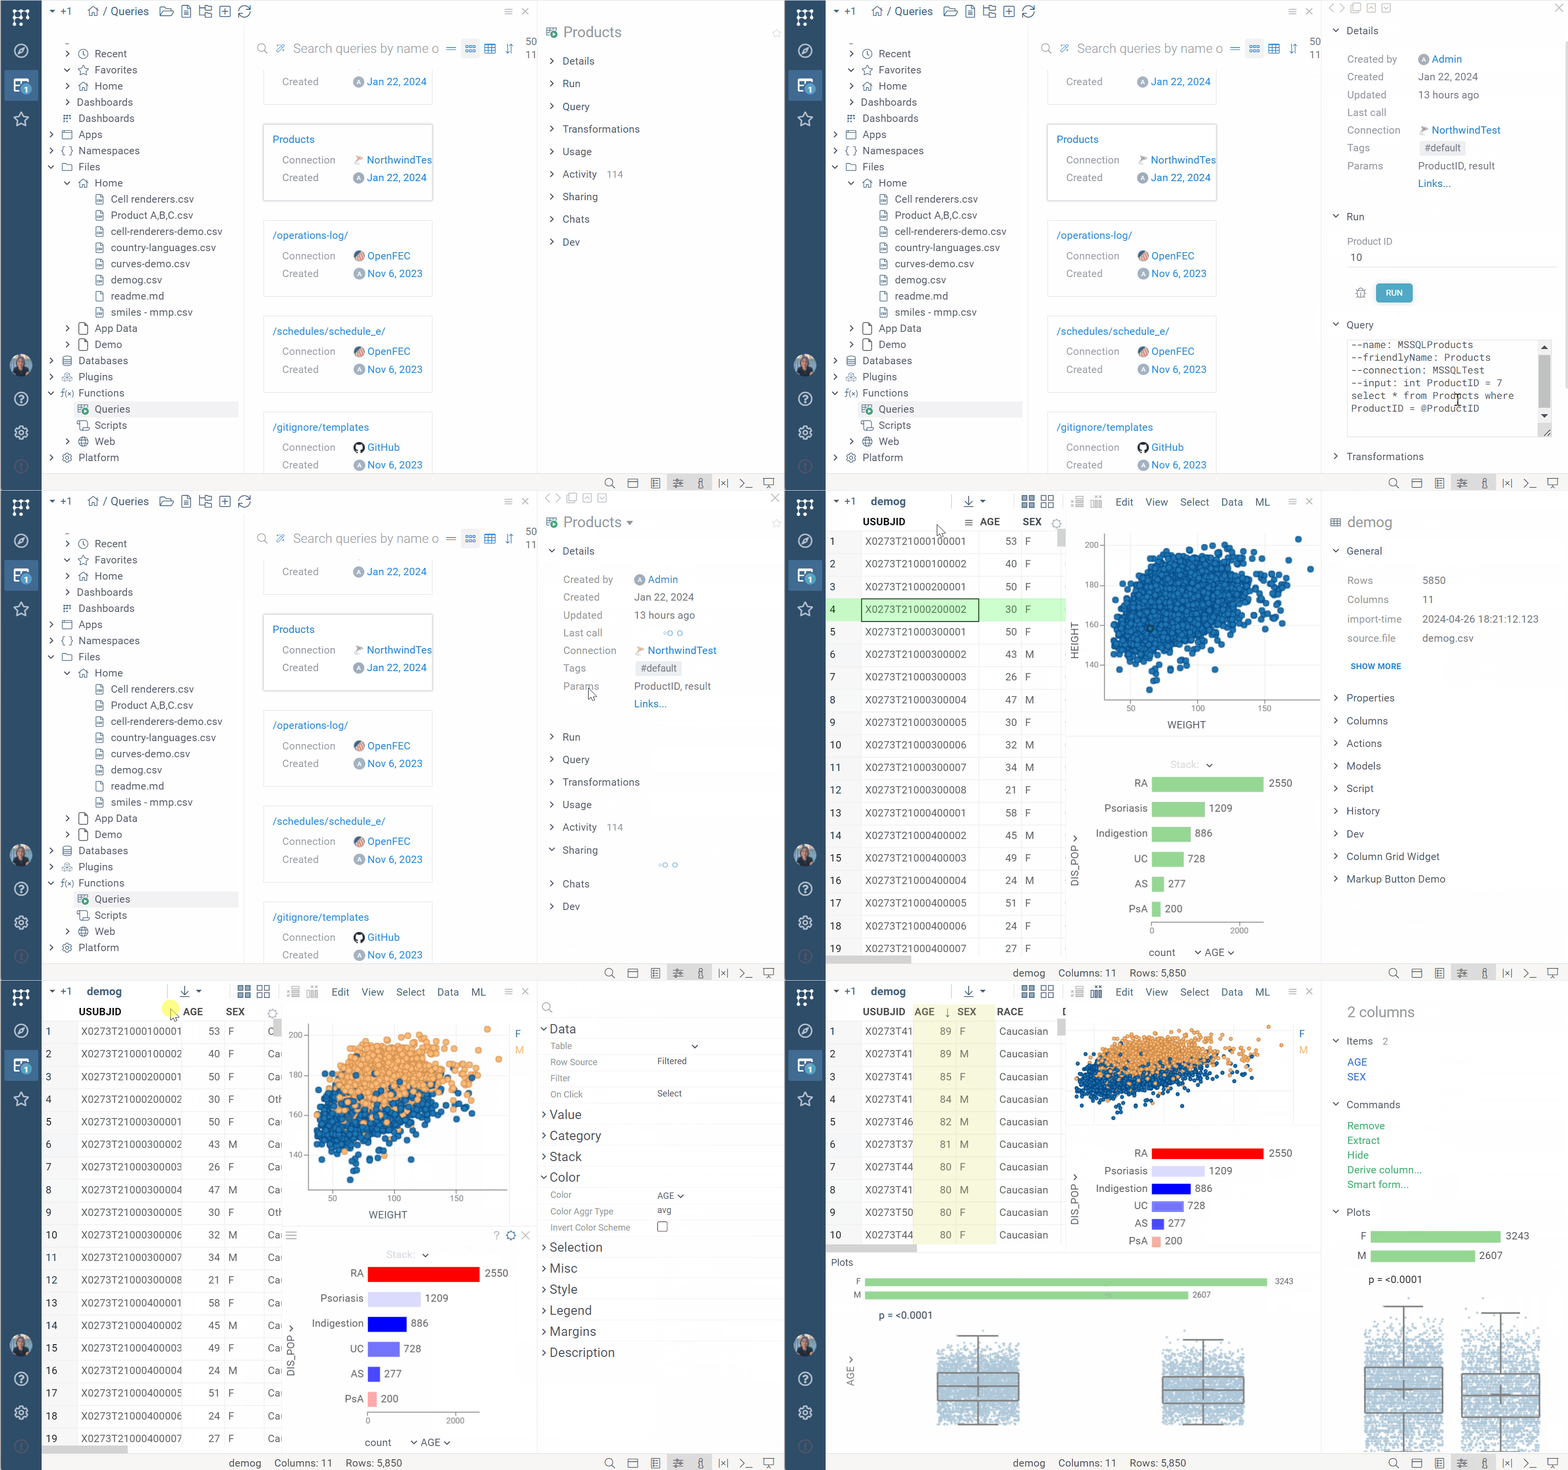
The Context Panel consists of distinct info panes, each serving a specific purpose. For example, the Actions info pane shows available commands, while the Details info pane shows the object's metadata. Depending on your privileges, individual info panes can be hidden or detached to float independently in a separate window. To toggle the visibility of the entire Context Panel, press F4.
Info pane examples
Developers: You can create custom info panes.
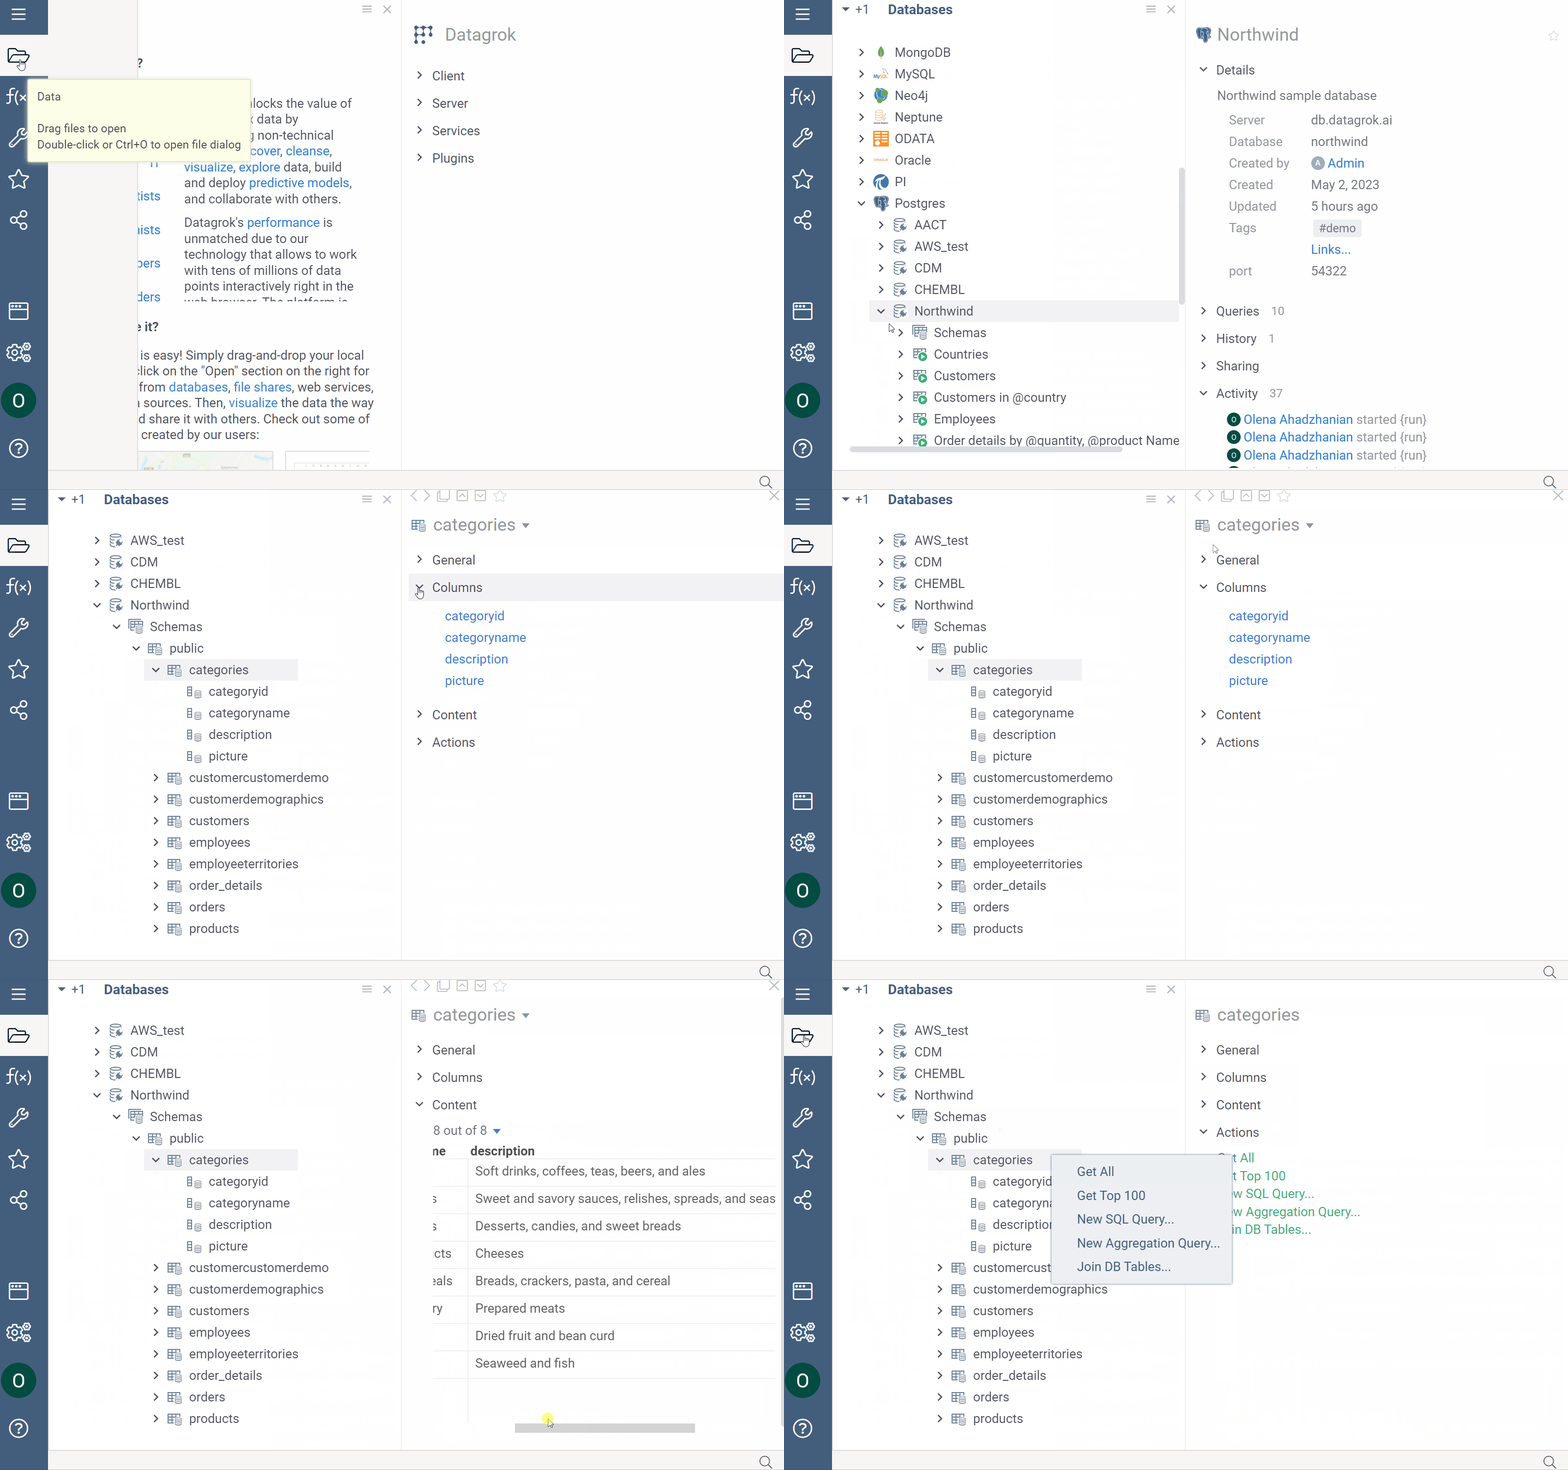
In this example, the info panes help you browse database objects, get data, and more. For example, when you click a table, the info panes let you view the table's metadata, dynamically preview the table's contents, or run queries.
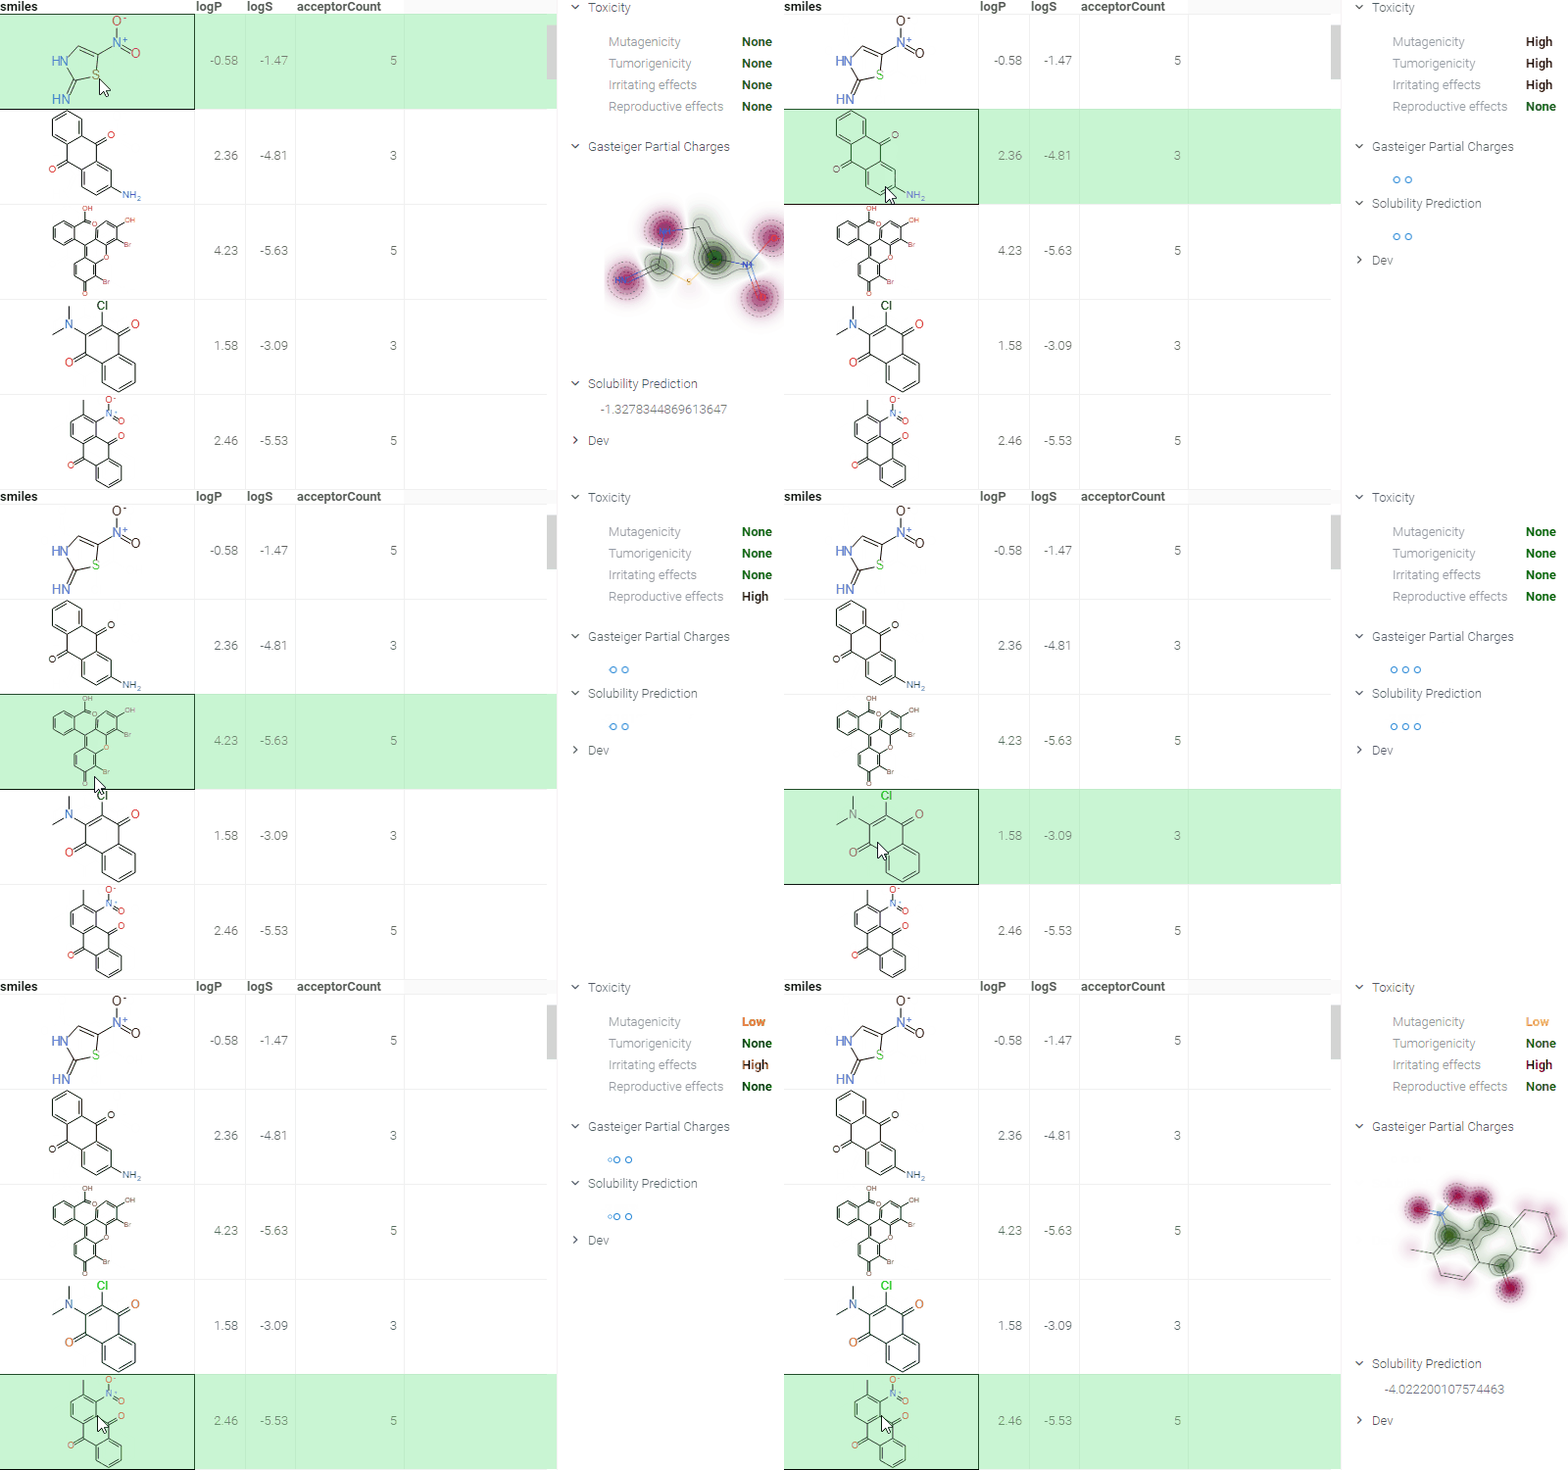
In this example, a number of scripts execute when you click a molecule, including calculation and visualization of the molecule's Gasteiger partial charges, solubility prediction, toxicity and so on. Learn more about the cheminformatics info panes.
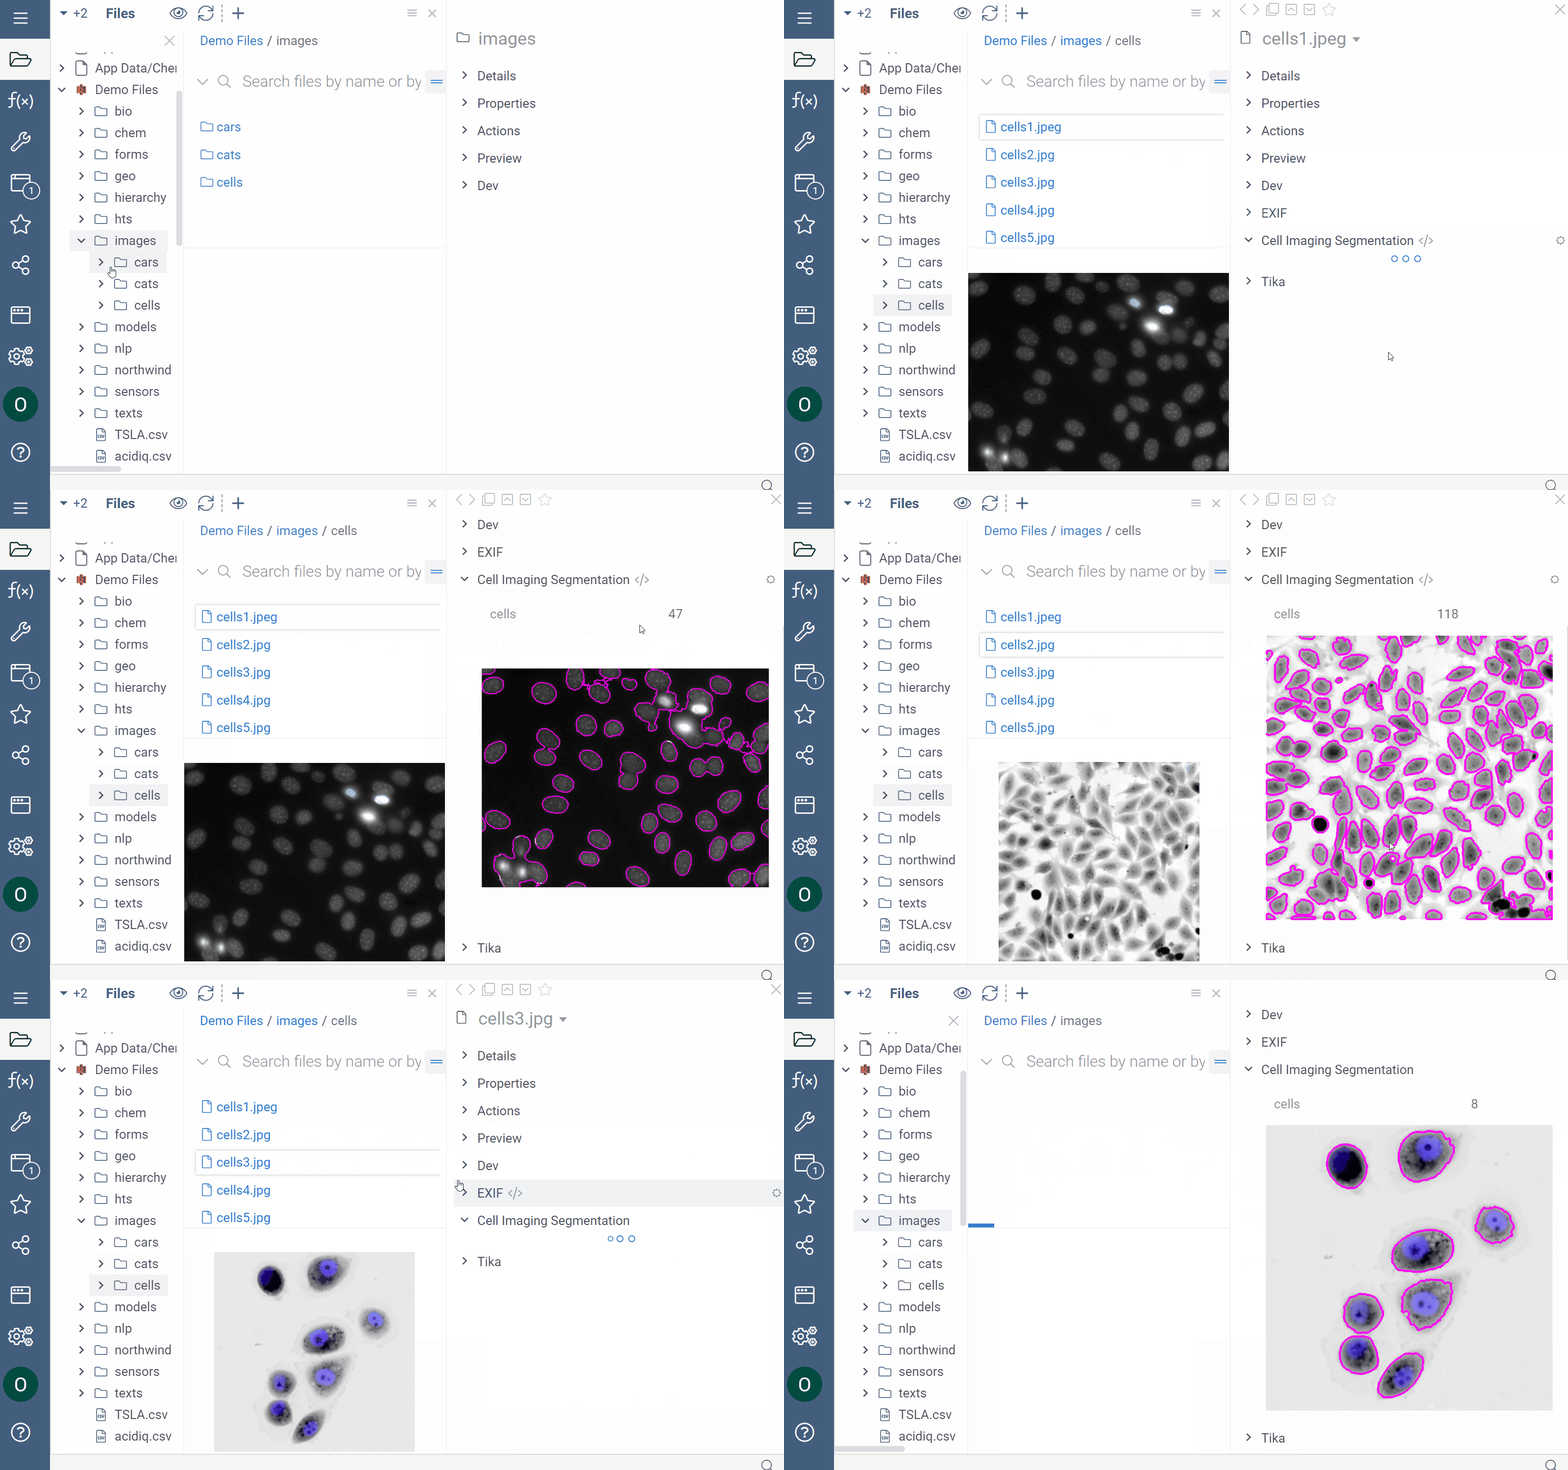
In this example, a Python script executes against JPEG and JPG files during the indexing process to get custom metadata (cell count) and performs specified transformations (segmenting cells). When you click a corresponding image, the info pane shows augmented file preview and the number of detected cell segments.
In this example, a query executes a similarity search on the ChEMBL database. When you click the query, it shows the Run info pane with a sketcher for drawing query molecules. As you sketch, the Context Panel updates dynamically to show details about your substructure.
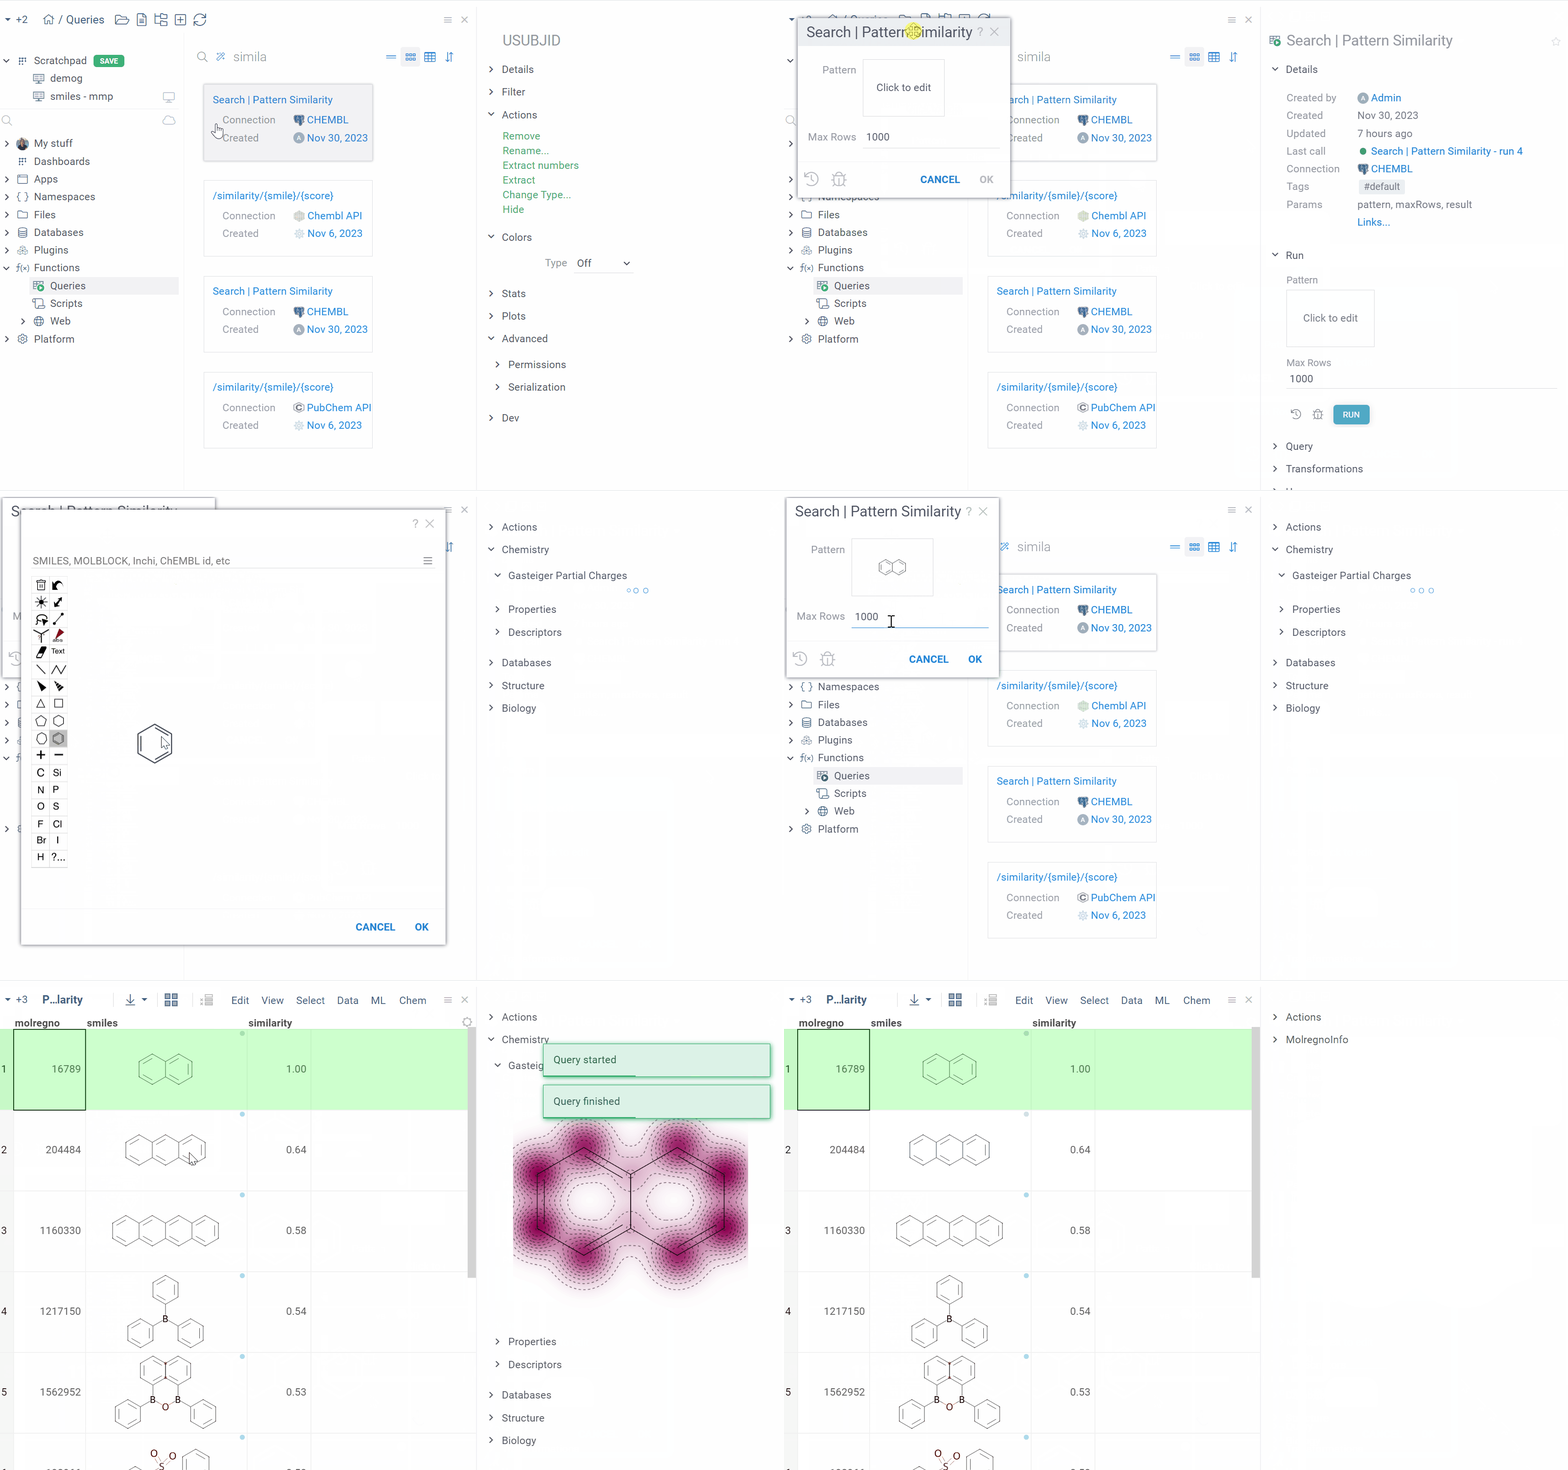
The Context Panel stores a history of viewed objects and your favorites, allowing you to quickly revisit past items or favorites. To access past items or favorites, use the icons on the panel's header.
You can create a static copy of the Context Panel for the current object by clicking the Clone and detach icon on the Context Panel's header. This action opens a copy of the Context Panel in a separate window. The content of the cloned panel remains static, while the main Context Panel continues to update with the current object.
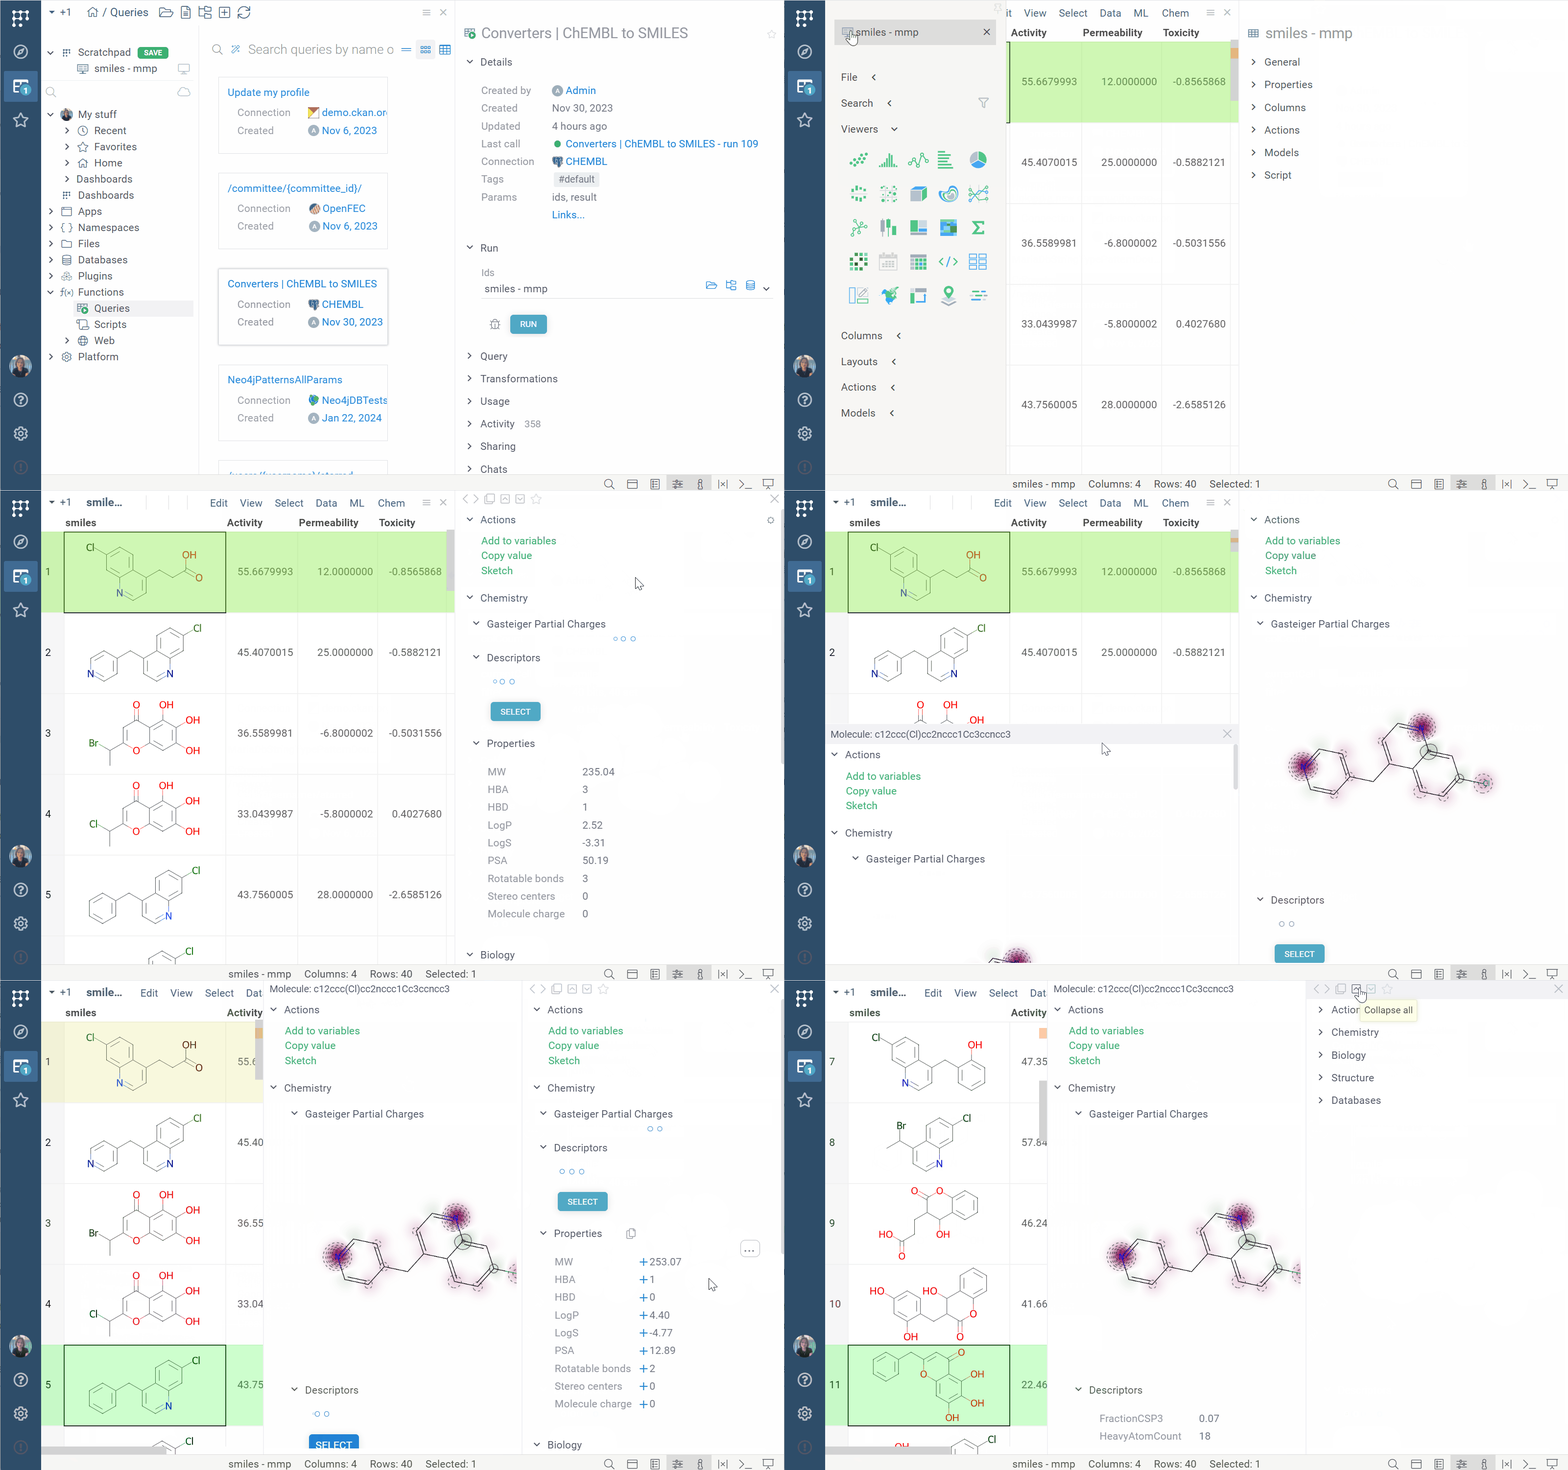
Context Panel controls
Hover over the panel's header to reveal these icons:
| Icon | Action |
|---|---|
| Back/Forward | Navigate between viewed objects |
| Clone and detach | Detach a copy of the Context Panel preserving its content |
| Collapse all | Collapse all info panes |
| Expand all | Expand all info panes |
| Favorites | Show the Context Panel for your favorite object |
You can favorite any Datagrok entity like a data connection, query, or a project. You can't favorite an individual file or a specific value within a cell.
Context Help
Context Help shows a help page relevant to your current object. By default, it's located in the bottom right corner of the screen, but you can toggle its visibility by pressing F1 or by clicking the Context Help (i) icon on the Status Bar.
To make an object current, click it.
To open the help page in a new browser window, click the Open in new tab icon on the panel's header.

Context Help controls
| Icon | Action |
|---|---|
| Back/Forward | Navigate between visited pages |
| Home page | Open Datagrok's wiki home page |
| Clone and extend to view | Open a page as your main view |
| Open in new tab | Open the help page in a new browser window |
Console
You can use Console to call functions and record macros. Clicking the function in the Console updates the Context Panel with its details.
Console uses Grok script language.
Command examples
Run the Mul command (multiply two numbers) with the specified parameters:
Mul(2,3)
Edit parameters of the Mul command and evaluate it in a dialog window:
Mul
Get help for the Mul command:
Mul?
Access the current object from the console with the o variable:
o.name
Select rows with empty values in the HEIGHT column:
SelectRows("demog", IsNull("HEIGHT"))
Extract rows with empty values in the HEIGHT column into a new dataframe:
ExtractRows("demog", IsNull("HEIGHT"))
To open Console, press the tilde key ~ or click the Console icon on the Status Bar.
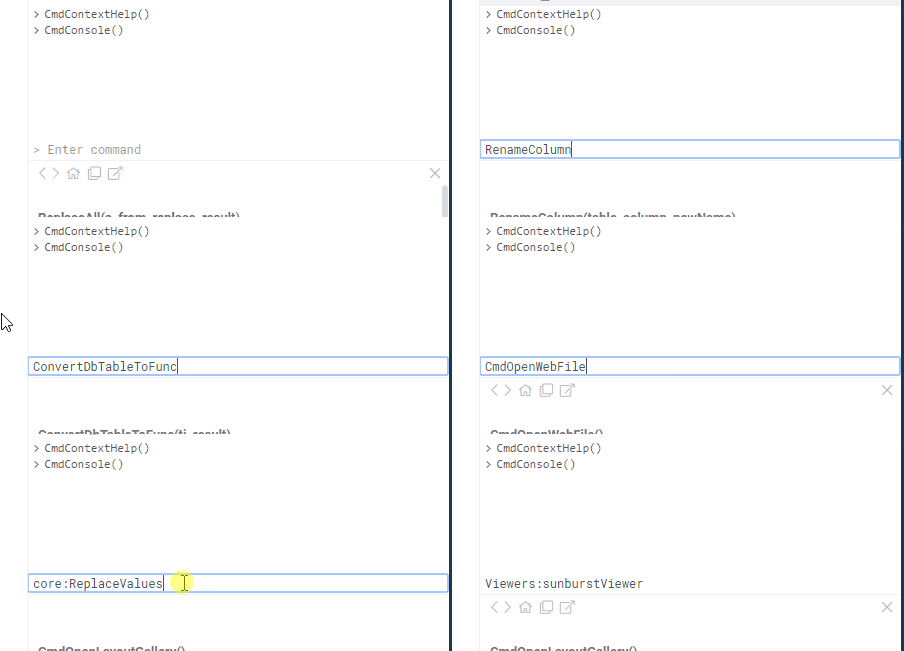
Console controls
At the top of the Console, there are two icons:
- Clear, which clears the content of the Console
- Variables, which opens the Variables panel.
| Key | Action |
|---|---|
Tilde ~ | Open the console |
| Tab | Complete a command |
| Up/Down | Previous/next command |
Recording macros
Every visual transformation on the platform corresponds to a specific function. Each function call is automatically logged in the Console, requiring no action on your part. This means you can both:
- Use the Console to examine which functions are triggered by particular UI events and reproduce these steps in the future. This can be useful for data transformations and data pipelines.
- Directly execute functions on your data from the Console, which is especially helpful for debugging custom functions within a package.
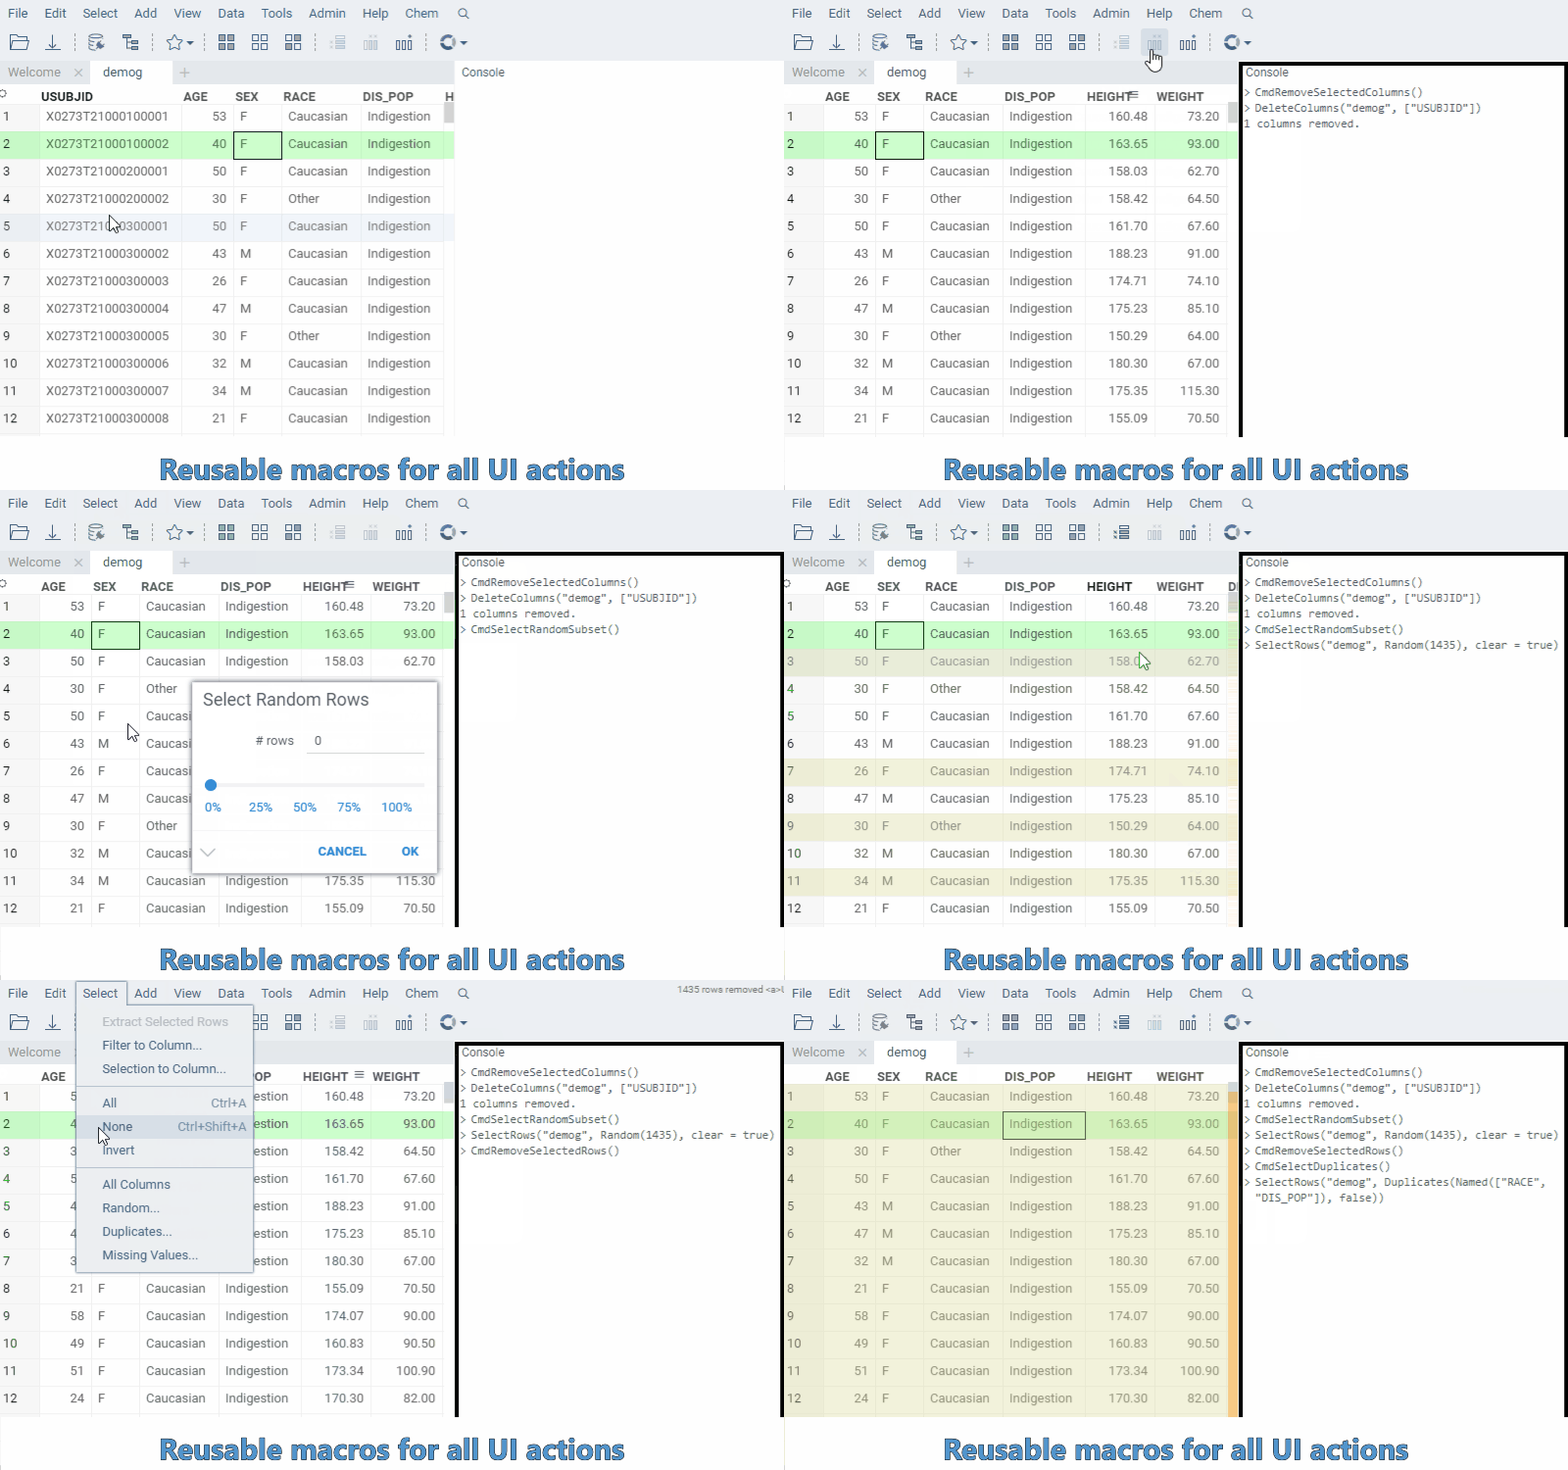
Variables
The Variables panel is used to declare variables and is commonly used for script debugging.
Variables can be declared in various ways:
- Through direct assignment in the Console, e.g.,
x = 5 - By dragging and dropping an object to the Variables panel.
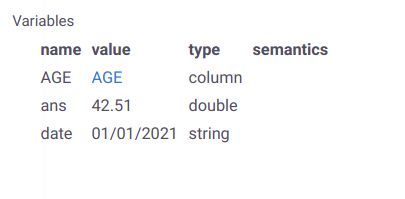
To open a Variables panel, press Alt + V or click the Variables (|x|) icon on the Sidebar.