Usage Analysis
Datagrok provides a fit-for-purpose application called Usage Analysis for monitoring and analyzing user activity. Built on top of Datagrok as a public package and developed in our public git repository, Usage Analysis is a testament to our belief in dogfooding.
Usage Analysis offers comprehensive statistics and insights into the usage patterns on Datagrok platform. By leveraging this app, you can better understand how users interact with the platform and make data-driven decisions that enhance user experience and optimize performance.
To launch Usage Analysis:
- On the Browse tree, find Usage Analysis under Apps.
- Right-click Usage Analysis and select Run.
Installing Usage Analysis adds the Usage widget on the Home Page.
Features
The Usage Analysis app consists of several tabs, each providing unique insights into platform usage:
- Overview: Serves as the central hub for understanding the overall usage
trends. It provides a holistic view of platform usage, allowing you
to:
- View period-on-period changes in new, active and selected users activity
- Track the number of unique users over time
- Compare package usage and users by their activity.
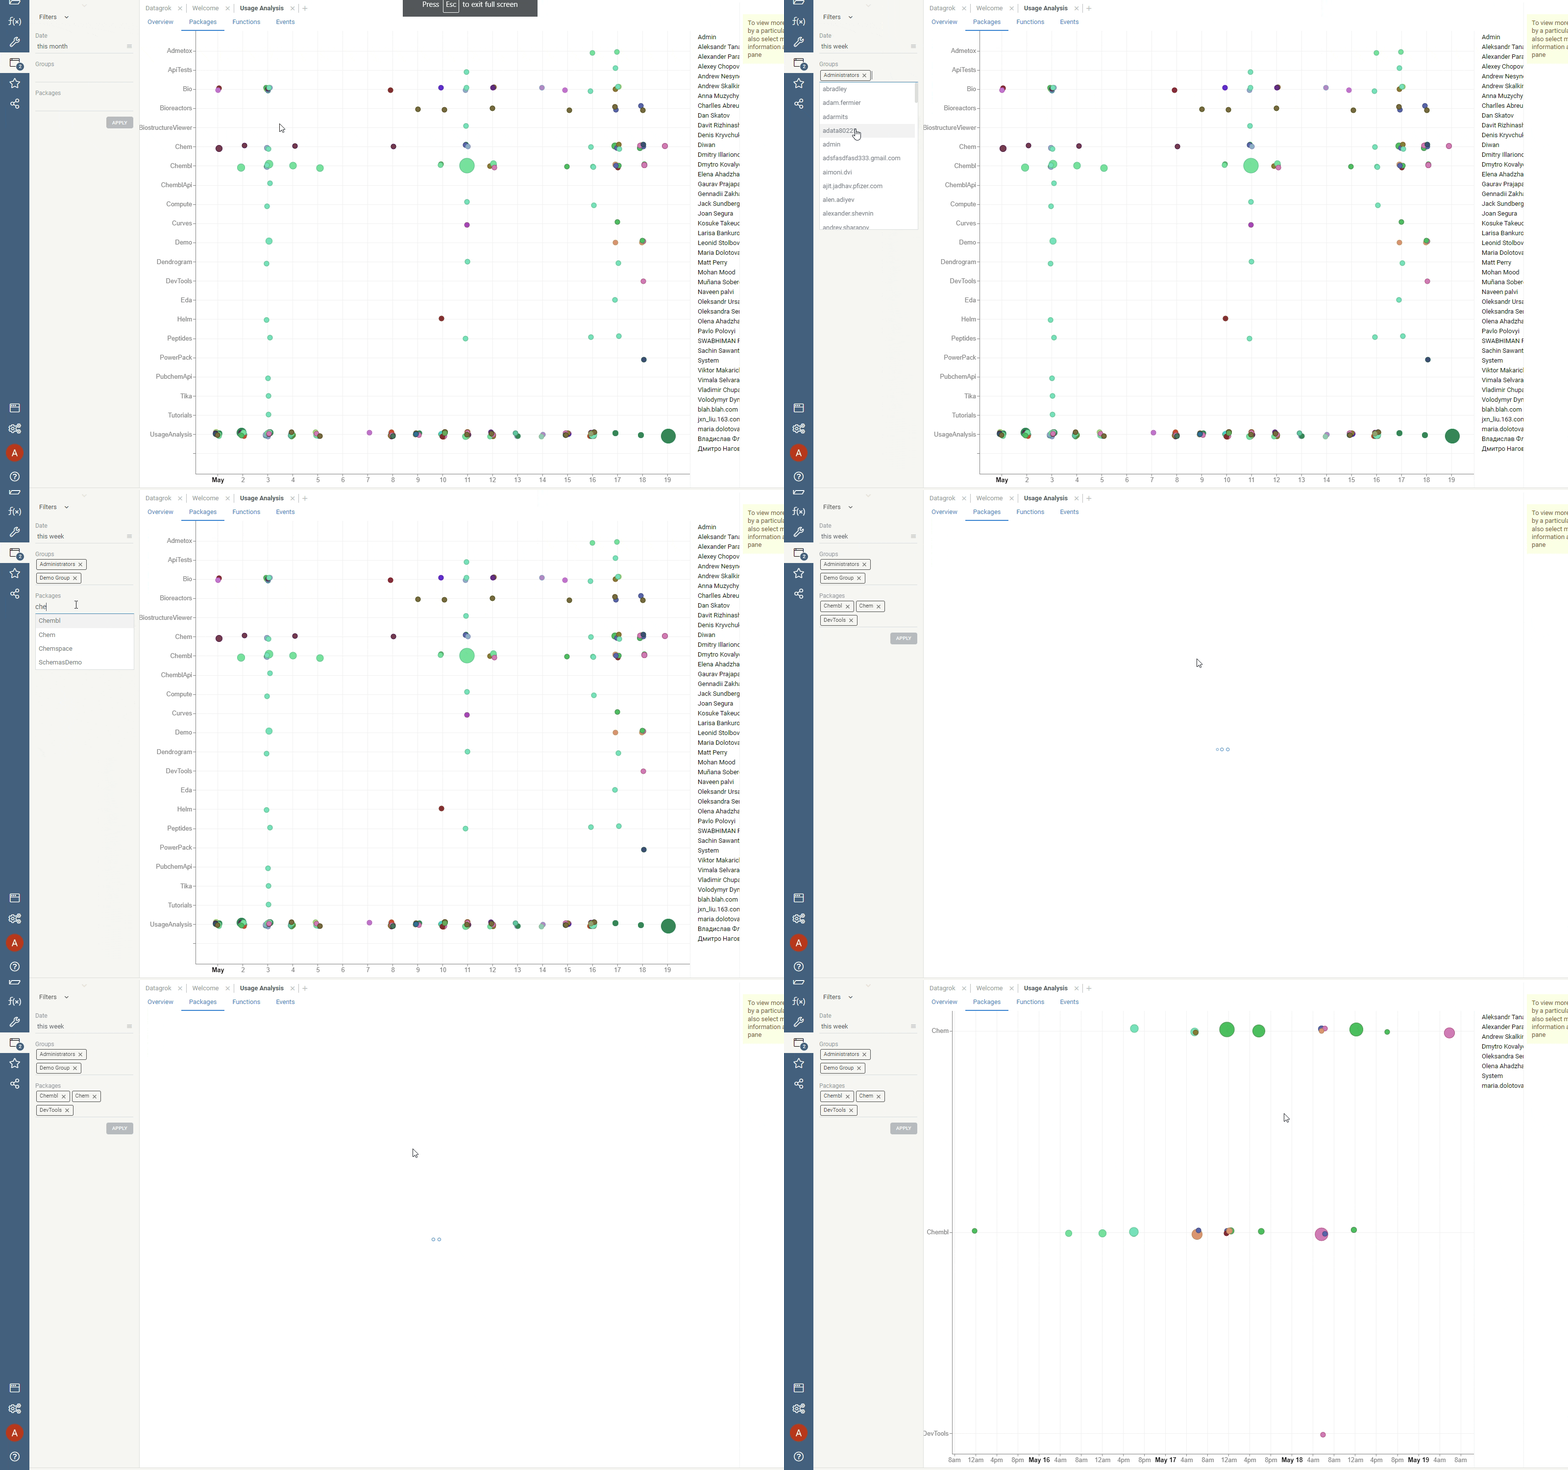
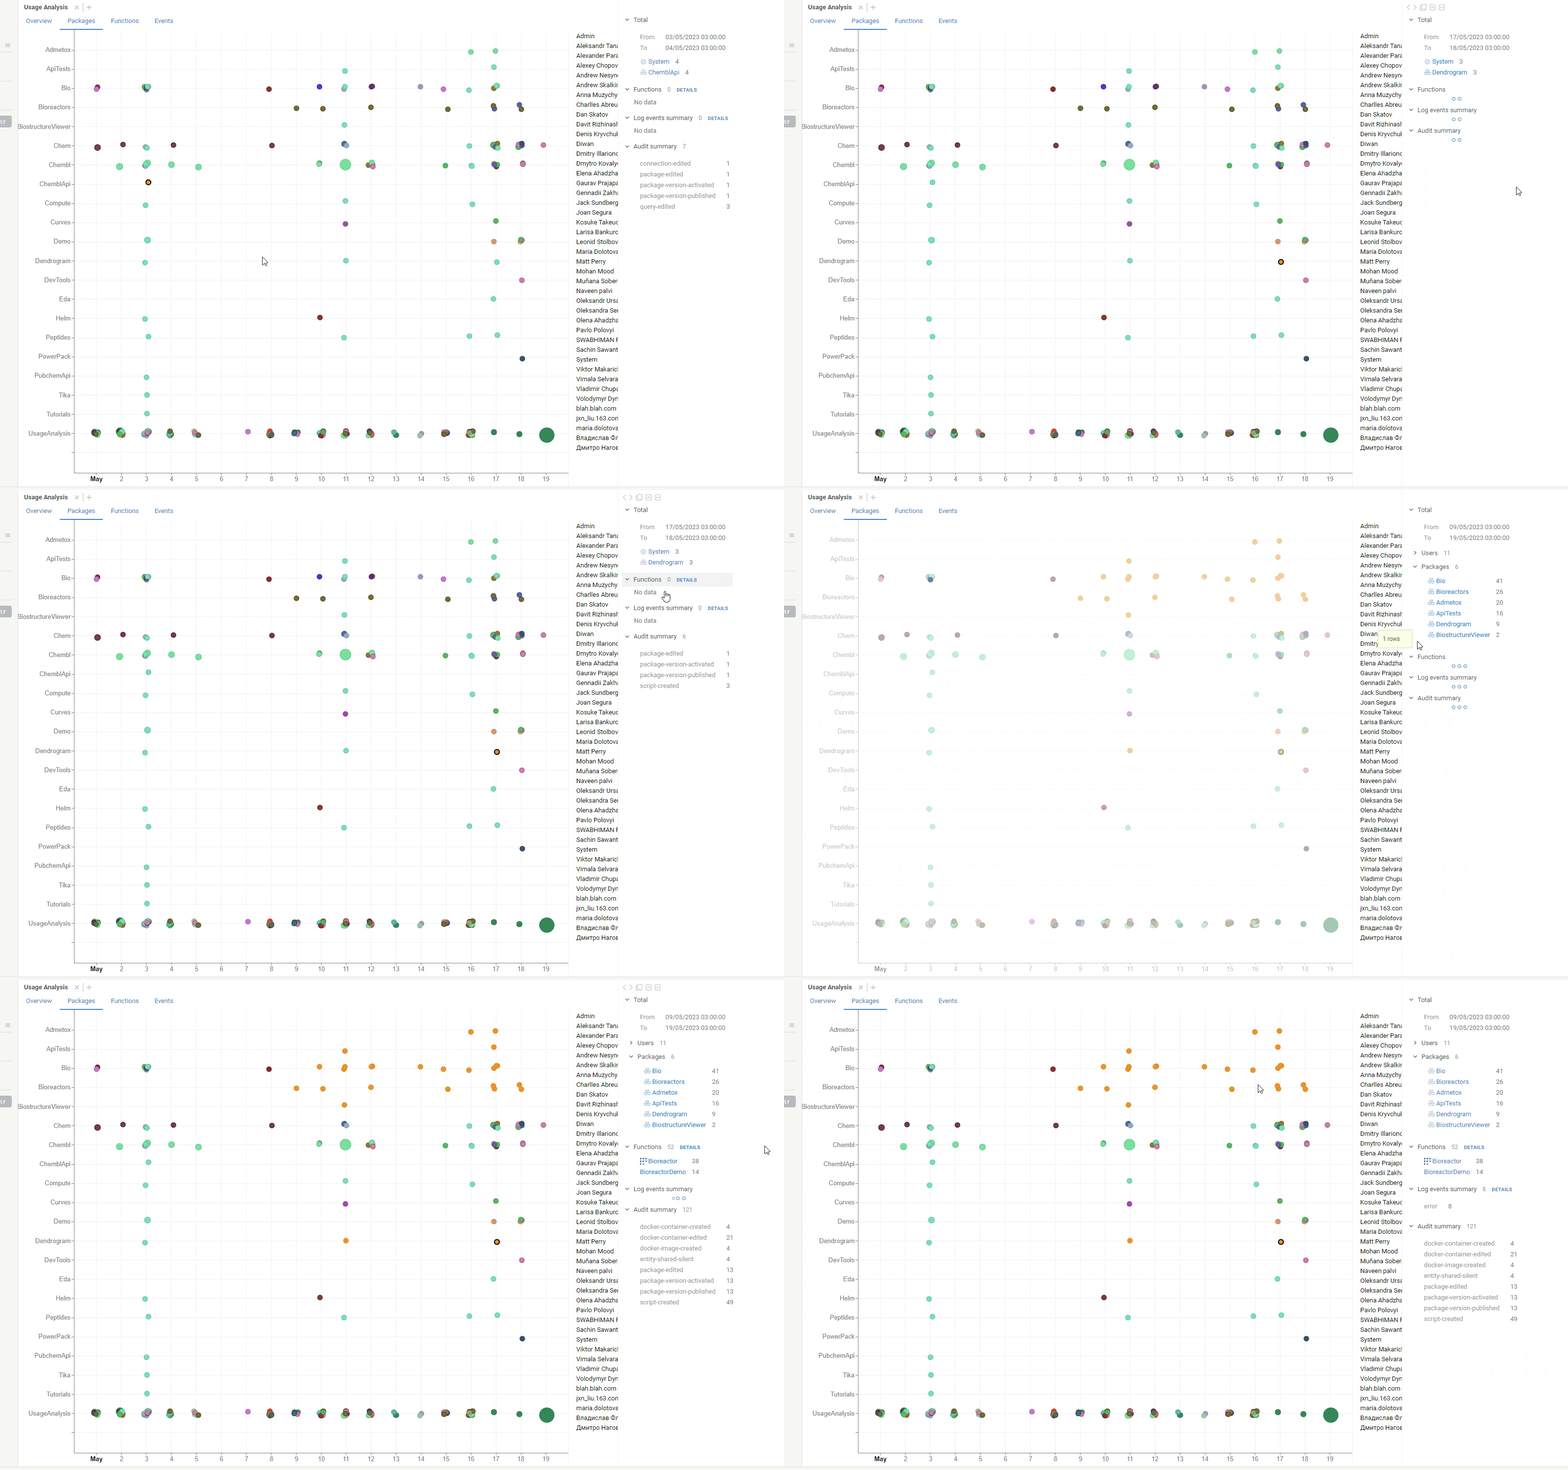
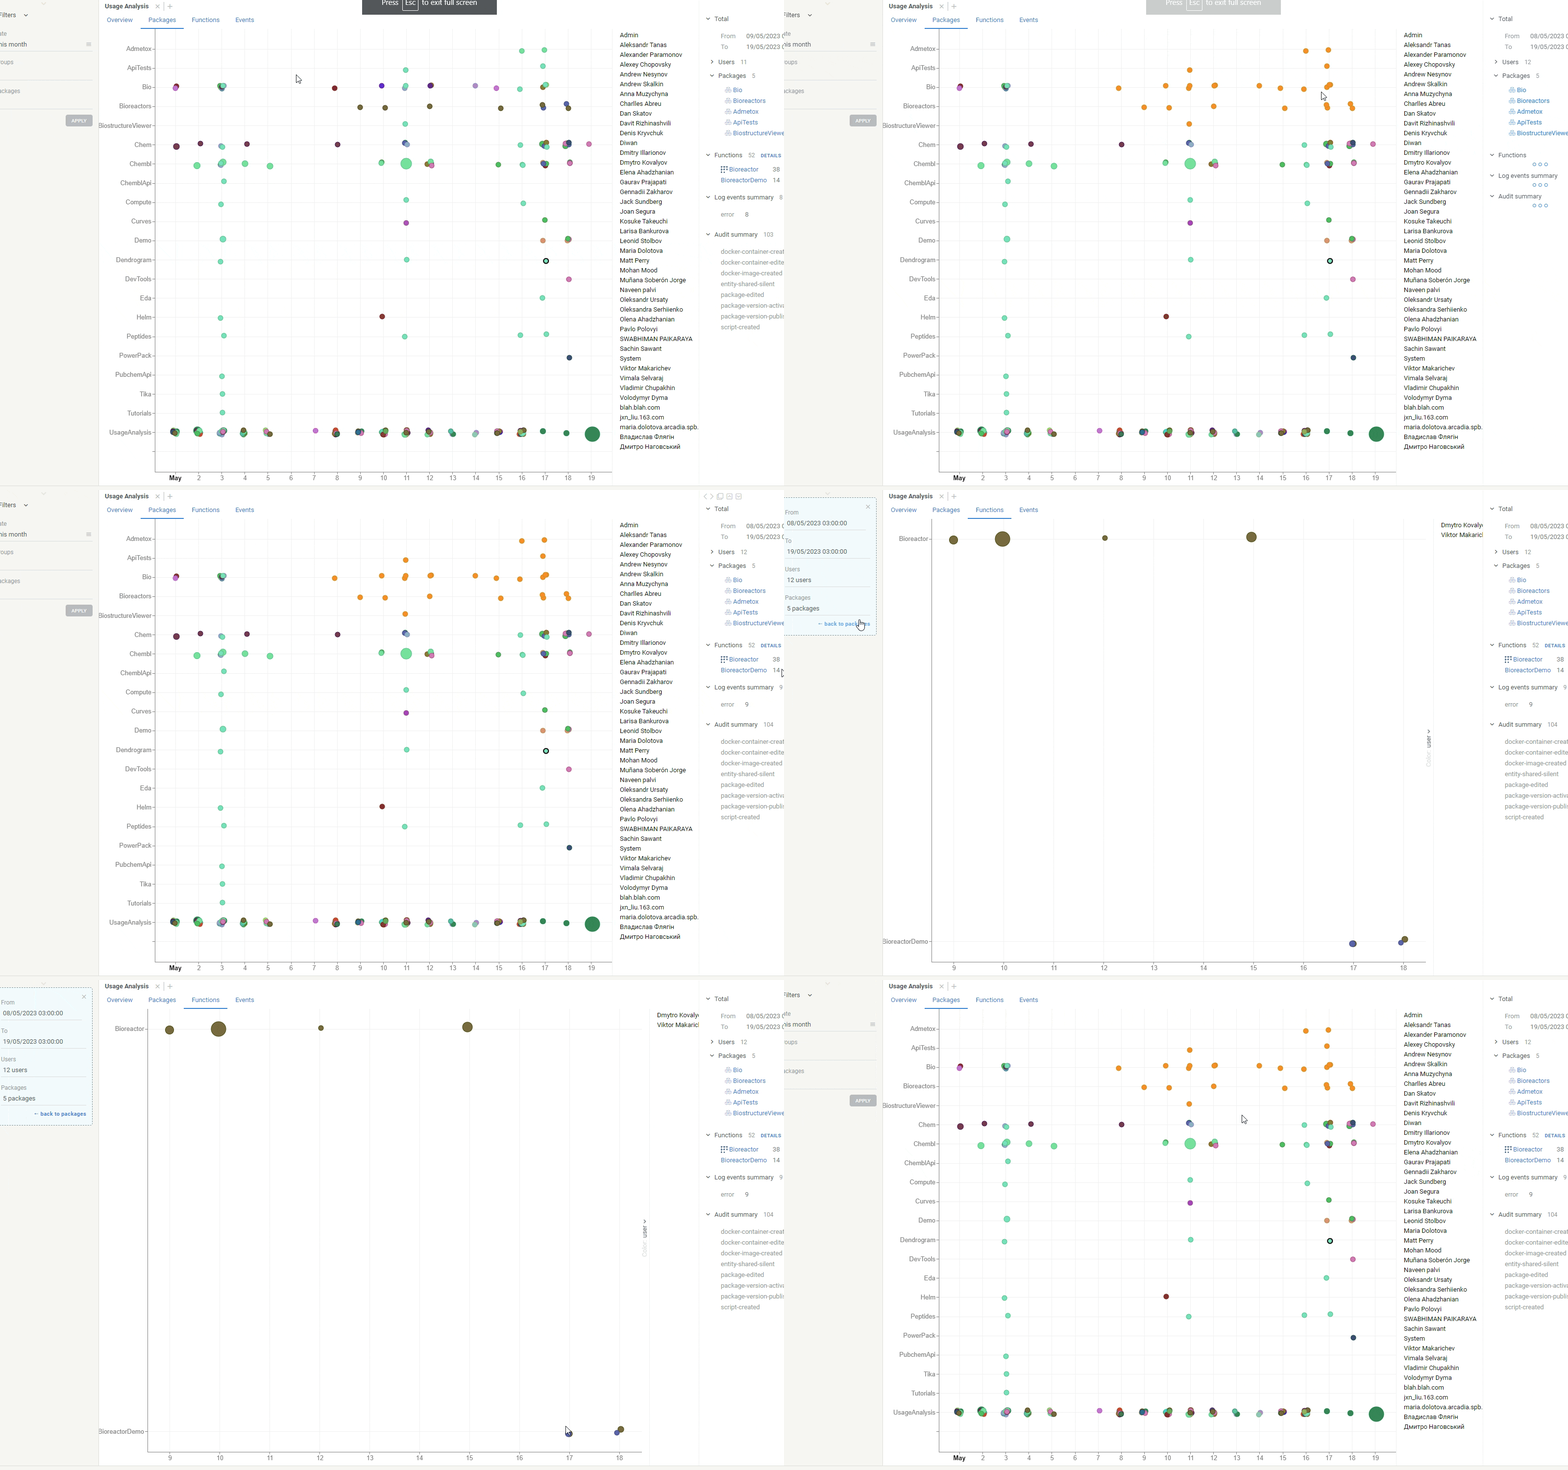
- Packages: Lets you analyze user activity across plugins. This data is visualized on an interactive scatterplot, making it easy to identify the most popular packages and/or find the ones that need attention.
- Functions: Similar to the Packages tab in design, the Functions tab helps you analyze how users engage with specific functions. By analyzing this data, you can:
- Identify the most frequently used functions
- Pinpoint areas of high or low user engagement
- Tailor Datagrok's functionalities accordingly
- Events: Lets you drill down into platform events:
- Sources: A line chart visualizes the sources of events, with each event color-coded. Using this chart, you can identify where the majority of activities originate.
- User events: A scatterplot visualizes events specific to individual users, allowing you to track their activity history and understand their usage patterns better.
- Log: A table lists all log events, which you can filter by user and source.
- Projects: Provides insights into how users interact with projects on the platform:
- Scatterplot shows a timeline of access events per project. The tooltip displays
access_count, which is the number of times a project was opened. - Unique Users Per Project: A barchart displays the number of distinct users who accessed each project over the given period.
- Access Frequency Daily: A table lists projects accessed more than once per day by at least one user:
- AVG Unique Users Daily – the average number of such users per day
- Days Between Access – the average time gap between project openings by different users.
- Scatterplot shows a timeline of access events per project. The tooltip displays
Native Datagrok capabilities
Like other Datagrok apps, Usage Analysis leverages many of Datagrok capabilities:
-
Global filters: Interact with usage data by focusing your analysis on a specific date range, user groups, or packages.

-
Interactive viewers: Datagrok viewers are synchronized and interactive. Clicking a datapoint on a scatterplot or selecting a category on a bar chart, lets you drill down into details.

-
Context-driven details: When you interact with data, such as clicking a datapoint on a scatterplot, the Context Panel on the right updates with relevant details. For higher-level tabs, such as Packages, clicking a datapoint on a scatterplot not only displays relevant information in the Context Panel but also provides a seamless way to navigate to other tabs for more specific information.
