User interface
This page explains how the Datagrok interface is organized, how its components work together, and how to navigate the platform.
Design principles
Datagrok builds the interface dynamically based on meaning. Whenever you open or click something, Datagrok looks at:
- what it is
- what it contains, and
- what can be done with it
Then it assembles the right UI automatically - the right view, panels, actions, tools, and visualizations.
Instead of fixed screens, the UI is made of modular components that appear, disappear, or adjust based on context. This creates a workspace that "groks" your data and helps you act on it.
Why this design
Scientific work is nonlinear
You move between raw data, transformations, visualizations, computations, statistics, model results, and heterogeneous data. Datagrok provides a workspace that allows all those steps to coexist and connect naturally.
It also gives the flexibility to arrange the workspace around your analysis: stack, dock, collapse, float, or hide elements or open multiple views side-by-side.
Many workflows - one mental model
Across domains and apps:
- the same Table View
- the same Context Panel
- the same docking and drag-and-drop
- the same viewer behavior
- the same semantic mechanisms
…all work consistently.
The "magic" comes from Datagrok’s semantic and execution layers:
- Semantic types: Identify the meaning of data (UIDs, molecules, zip codes, etc.)
- Functions: Describe operations and generate UI elements for those data types
- File handlers and file viewers: Inspect and interpret file format and content to choose the correct "document type" (e.g., protein viewer for PDB files, Table View for tabular data)
Together, they determine:
- which view opens
- which viewer is used
- which actions appear in menus
- which info panes show up in the Context Panel
- which tools appear in the Toolbox
Once you learn the core components, your skills transfer across the entire ecosystem, and teams can collaborate freely.
The sections below describe the workspace layout and its core building blocks. Specific data tools are documented in their respective sections. Once you're ready to move on to data work, start with Table View and viewers. These are the key interfaces for exploration and visualization and are covered in the Visualize section.
Workspace layout
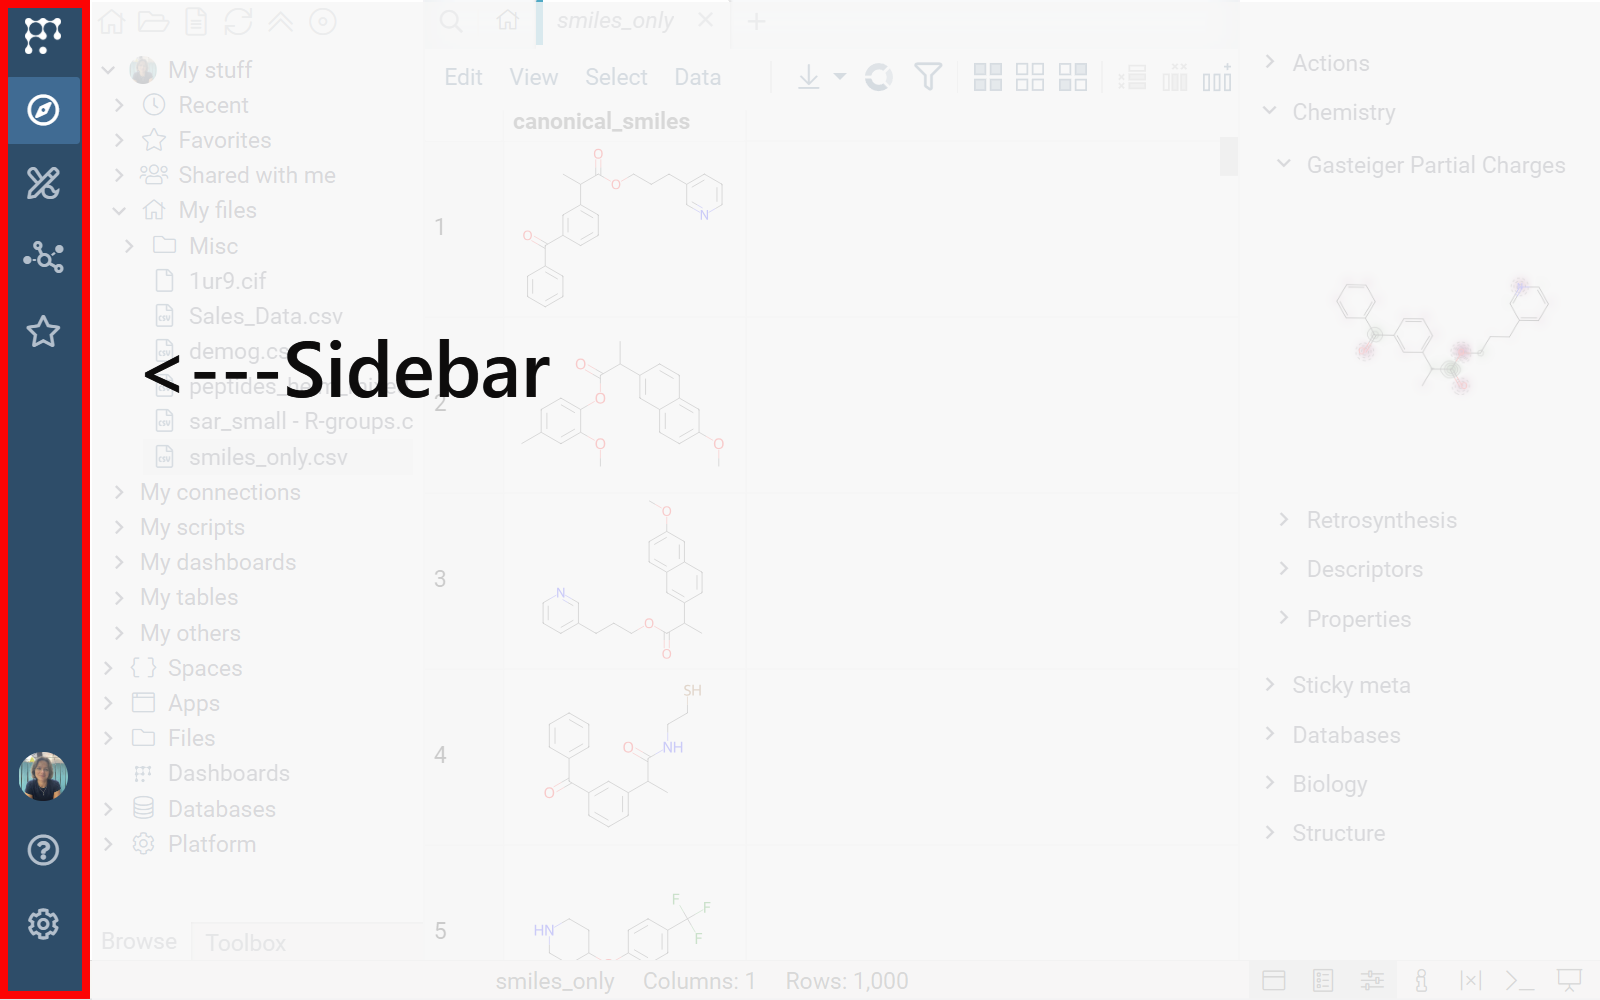
The workspace is organized into five main areas:
- Sidebar
- Browse/Toolbox
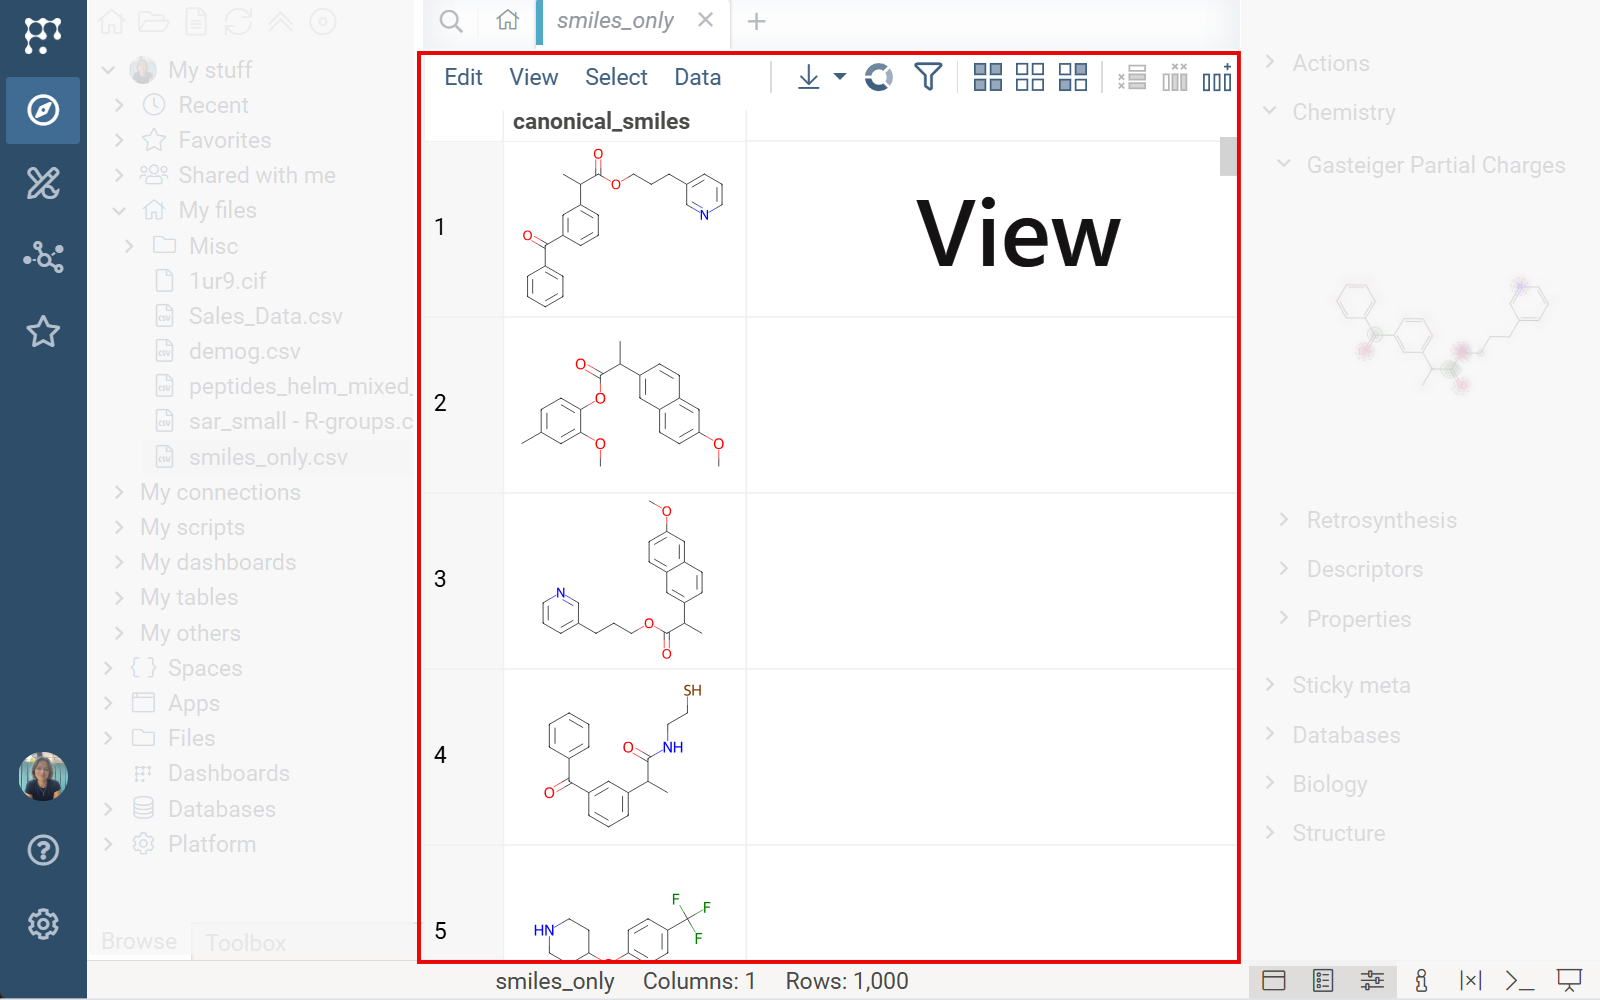
- View
- Panels
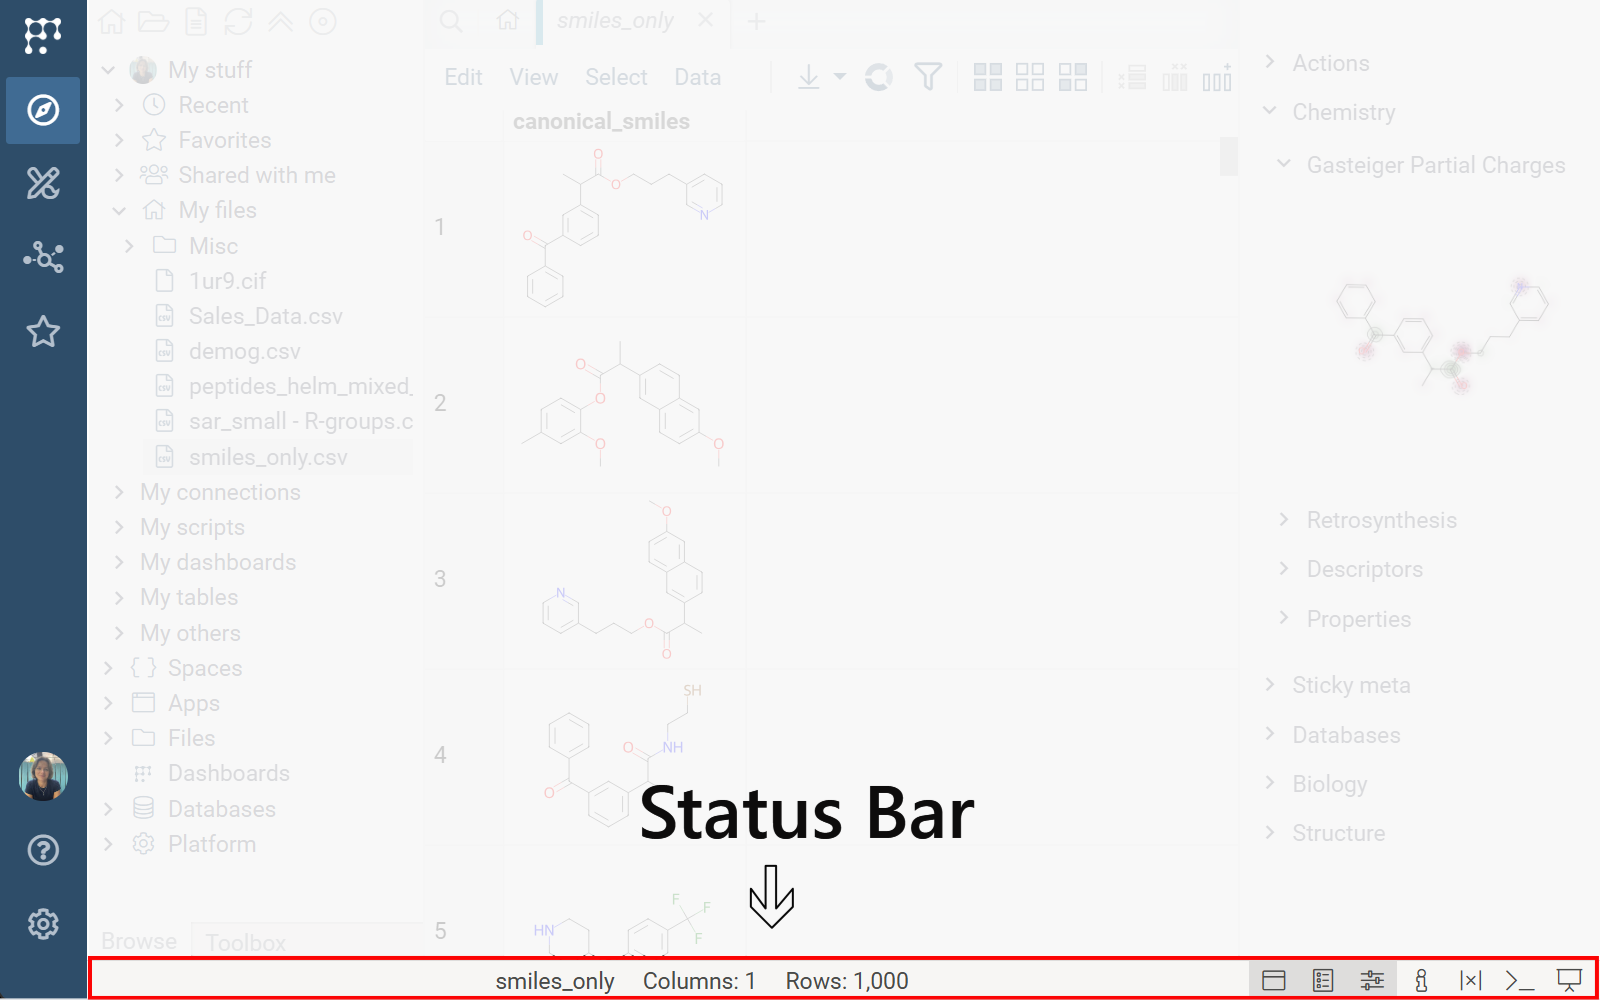
- Status Bar
Has icons for commands, Browse, Toolbox, dashboards, favorites, your profile, help, and settings.
Your current view - the main working surface.
Typically on the right. Available panels include: Context Panel, Context Help, Console, Variables. By default, only Context Panel and Context Help are visible. Toggle all from the Status Bar.
Has three sections:
- left: progress bar for running tasks
- center: view-specific info (e.g., table name, row counts, etc.)
- right: viewing mode and panel toggles
Views
A view is a working surface for a specific task (e.g., Home Page, Table View, Query Editor) - similar to opening Word, Excel, or PowerPoint in Microsoft Office.
A view:
- usually occupies the center workspace
- has a Top Menu
- may come with a Toolbox
- contains task-specific components (viewers, UI controls, etc.)
Examples
- Table View
- Query Editor
A Table View, used for exploratory data analysis, has a Top Menu with data-related commands and a Toolbox that provides quick access to viewers, view layouts, models, and more.

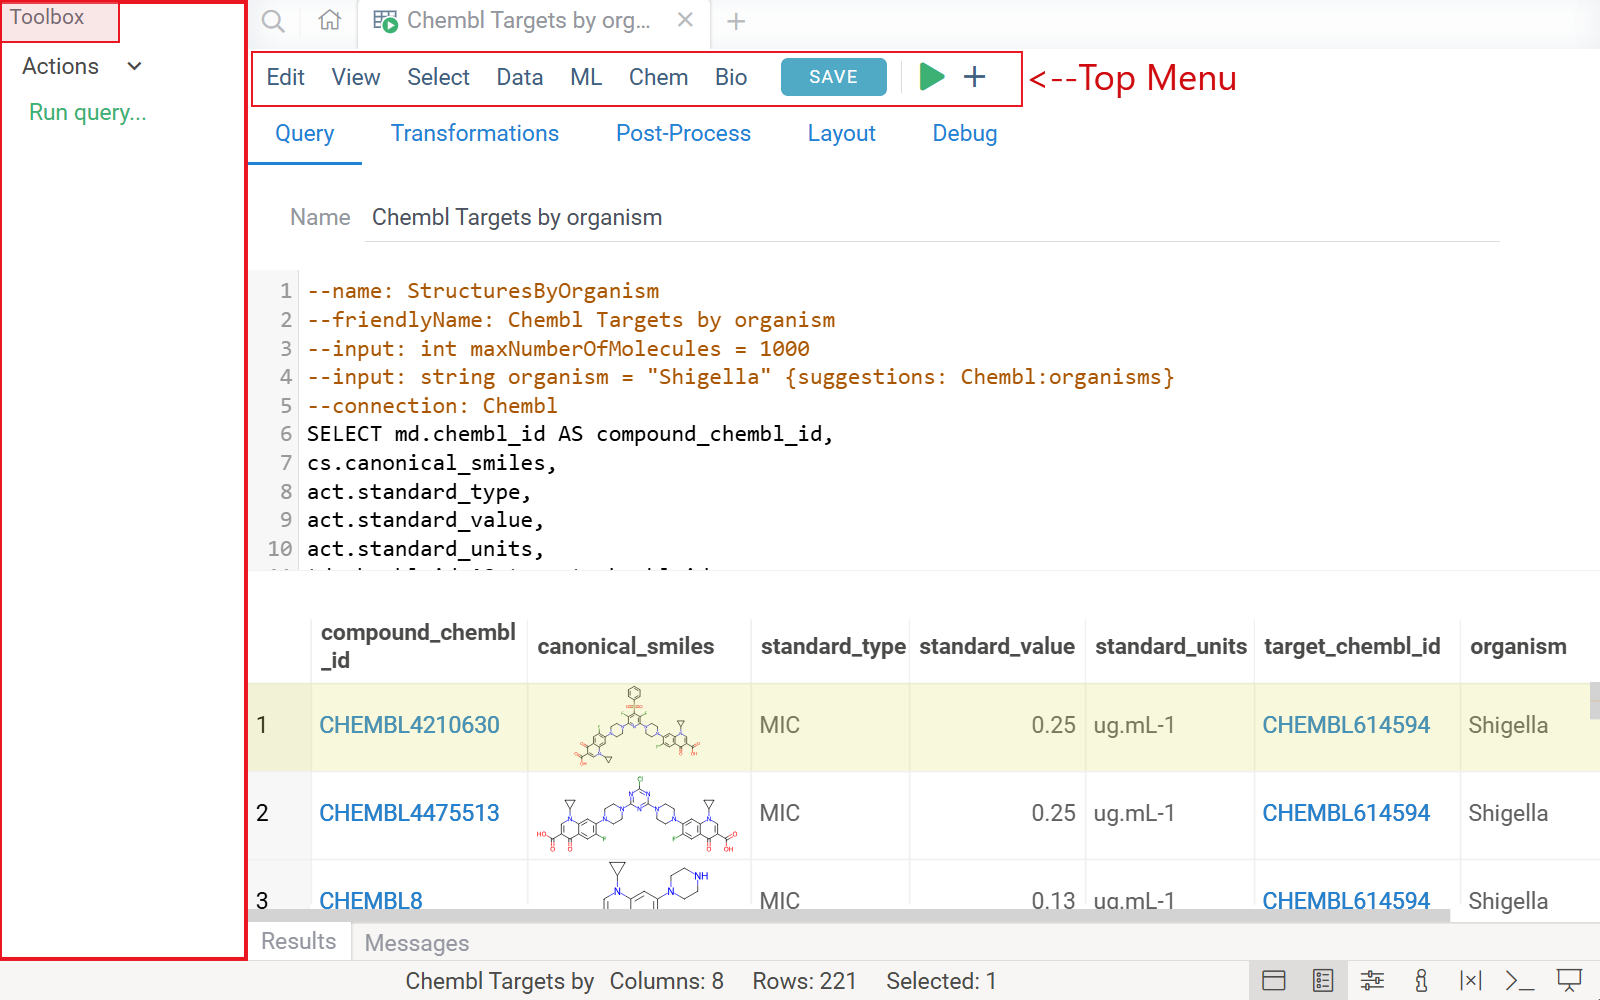
A Query Editor has Top Menu for working with query output and Toolbox with available actions.
To learn how a particular view works, see its corresponding section in the documentation (e.g., Visualize > Table View or Access > Databases | Query Editor).
You can open multiple views and switch between them. Datagrok has three viewing modes:
- Tabbed: Browser-style tabs
- Simple: Switch using a dropdown selector
- Presentation: Hides everything except the active view
Try all (toggle from the Status Bar) to see which fits your workflow.
You can also split the center workspace (click the view's Hamburger icon and select Split right or Split down).
Toolbox + Top Menu
These components expose view-specific actions:
- Top Menu (fixed at top of view): View-specific commands
- Toolbox (left side, tabs with Browse): Used for placing view-specific UI controls: buttons, fields, icons, links, dropdown menus, etc. For example:
- Table View: Search, viewer icons, layouts, models, and more
- Platform Settings view: Links to all settings views
In browsing mode, the left panel shows Browse only. When a view becomes persistent (e.g., on double-click or when you make an edit) or when you open the Toolbox explicitly via the Sidebar icon, Toolbox appears as a tab alongside Browse (at the bottom of the left panel). You can stack, close, or switch between Browse and Toolbox as needed. Reopen both from the Sidebar.
Browse
Browse is your entry point to everything on the platform - projects, queries, files, connections, platform settings, apps, and more. It also serves as your data catalog: an item's location determines its access rights (learn more).
Clicking an item in the tree opens it's view in the center, for example:
- Tables, dashboards, files open as working documents you can explore and edit
- Folders open as folder views
- Entity catalogs (functions, users, layouts, etc.) open as galleries
- Database schemas open as interactive schema browsers
When you click an item, each item's view replaces the previous one. This is browsing mode. A view becomes persistent (remains open until manually closed) when you:
- Make any edit
- Pin the view (in tabbed mode, hover over the tab's blue left border and click the pin)
- Double click an item
You can't convert a persistent view back to browsing mode. To start a new browsing session, on the Sidebar, click the Browse icon () and then click the item from the tree.
For details on what each section of the Browse tree contains, see Browse tree in the Navigation section.
Browse controls
Browse's Top Menu:
- : open Home Page view
- : import file
- : open Import text view
- : refresh tree (pulls updates from the server)
- : collapses all tree nodes
- : locate current object
Within the tree:
- Click: opens the item's in an unpinned view
- Double-click: opens the item in a persistent (pinned) view
- Right-click: opens the context menu
Keyboard navigation:
Use the up/down (↑↓) keys to navigate and the left/right (←→) keys to expand a tree node.
Panels
Panels provide contextual and auxiliary tools:
- Context Panel: settings, actions, and info for the current object
- Context Help: help on the current object
- Console: command line
- Variables: script debugging
Toggle any panel from the Status Bar.
Context Panel
Context Panel serves two roles:
- Information and actions for your current object: A container for info panes that updates automatically based on context:
- Click a molecule and see its weight, toxicity, and structure
- Click a query and see its SQL code and parameters
- Click a column and see statistics
- Component settings: Access to settings for visual UI components like viewers or widgets (via the Gear () icon).
Context Panel keeps history and favorites, and you can clone it into a static window.
Context Panel controls
Hover over header to reveal:
| Icon | Action |
|---|---|
| Back/Forward | Navigate between viewed objects |
| Clone and detach | Detach a static copy of the Context Panel preserving its content. This action opens a copy of the Context Panel in a separate window. The content of the cloned panel remains static, while the main Context Panel continues to update with the current object. |
| Collapse all | Collapse all info panes |
| Expand all | Collapse all info panes |
| Favorites | Show the Context Panel for your favorite object |
Note: You can favorite any Datagrok entity like a data connection, query, or a project. You can't favorite an individual file or a specific value within a cell.
Info panes
Info panes provide context-specific information or actions. Each info pane serves a specific purpose. The available panes depend on what you click — chemistry data surfaces different panes than column data or a query. For default info panes, see Info panes reference.
Info pane examples
- Details and actions
- Calculation and visualization
- Image augmentation
- Running queries
In this example, the info panes help you browse database objects, get data, and more. For example, when you click a table, the info panes let you view the table's metadata, dynamically preview the table's contents, or run queries.
In this example, a number of scripts execute when you click a molecule, including calculation and visualization of the molecule's Gasteiger partial charges, solubility prediction, toxicity and so on. Learn more about the cheminformatics info panes.
In this example, a Python script executes against JPEG and JPG files during the indexing process to get custom metadata (cell count) and performs specified transformations (segmenting cells). When you click a corresponding image, the info pane shows augmented file preview and the number of detected cell segments.
In this example, a query executes a similarity search on the ChEMBL database. When you click the query, it shows the Run info pane with a sketcher for drawing query molecules. As you sketch, the Context Panel updates dynamically to show details about your substructure.
Info panes are displayed based on specific conditions: user, dataset, context, user preferences.
When the current object changes, the conditions of all registered info panes are checked against the specified parameters, and matching info panes are displayed accordingly.
Subject to your permissions, you can control the display of an info pane from the UI. To hide a specific info pane, click the Gear icon on the pane header, then click Do not show. To manage hidden panes, on the Sidebar, click Settings > Panels, and add or remove hidden panes from there.
Context Help
Context Help shows help for the current object. By default, it's located in the bottom right corner of the screen. Toggle with F1 or via the Status Bar.
To make an object current, click it.

Context Help controls
Hover over header to reveal:
| Icon | Action |
|---|---|
| Back/Forward | Navigate between visited pages |
| Home page | Open Datagrok's wiki home page |
| Clone and extend to view | Open a page as your main view |
| Open in new tab | Open the help page in a new browser window |
Console
The Console is Datagrok's command-line interface. It lets you call functions, inspect objects, record macros, and understand how the platform behaves under the hood. Clicking the function in the Console updates the Context Panel with information about it.
Open with ~ or via the Status Bar.

Command examples
Console uses GrokScript to call platform functions. For example:
Run the Mul command (multiply two numbers) with the specified parameters:
Mul(2,3)
Edit parameters of the Mul command and evaluate it in a dialog window:
Mul
Get help for the Mul command:
Mul?
Access the current object from the console with the o variable:
o.name
Select rows with empty values in the HEIGHT column:
SelectRows("demog", IsNull("HEIGHT"))
Extract rows with empty values in the HEIGHT column into a new dataframe:
ExtractRows("demog", IsNull("HEIGHT"))
Console controls
At the top of the Console, there are two icons:
- Clear: Clears the Console
- Variables: opens the Variables panel.
| Key | Action |
|---|---|
Tilde ~ | Open the console |
| Tab | Complete a command |
| Up/Down | Previous/next command |
Variables
Use the Variables panel to declare and inspect variables for script debugging. Open with Alt + V or via the Sidebar.

You can declare variables as follows:
- Assign directly in the Console, e.g.,
x = 5 - Drag and drop an object to the Variables panel.
Arranging your workspace
Datagrok's layout system is fully flexible. You can customize the default panel visibility in Sidebar > Settings > Windows. You can also reposition and resize almost anything. Drag any component's header to see highlighted drop zones, then dock it where you need it. You can:
- dock components into highlighted drop zones
- float panels or info panes as separate windows
- stack components vertically or horizontally
- resize any docked area
- split views to work side-by-side
The only fixed elements are the Sidebar and the Status Bar.
Most rearrangement happens at the application level (views and panels). However, some views (especially Table View) also have their own internal docking manager that lets you organize components (e.g., viewers) inside the view without affecting the global layout.
Developer notes
Top-level docking
- Controlled via
grok.shell.dockManager - Supports docking/undocking windows across main workspace
- Use
View.dockNodeto programmatically dock a view
Nested docking
- Certain views (e.g., Table View) include their own
view.dockManager - Arranges viewers and UI components within the view
- Nested components cannot undock to global workspace
Drag and drop
Drag and drop objects to quickly move or apply them. Available drop zones are highlighted when you start dragging.
Examples:
- Drag columns to reorder them within a spreadsheet
- Drag columns to viewers, dialogs, or filters
- Drag items in Browse to reorganize the tree structure
- Drag entities from Browse to info panes to reference them (e.g., adding a user to a chat) or to panels to work with them (like dropping a function into Console to inspect or run it)

Navigation
Use this section when you want to understand how to find things, not how each individual view or panel behaves (for that, see Workspace layout). For basic tasks like "export a file" or "create a project", see Basic tasks.
Datagrok provides several navigation mechanisms so you can pick the most efficient path for what you’re doing:
-
Browse: Platform-wide catalog of everything on the platform - your personal workspace, projects, apps, dashboards, files, queries, connected repositories, users, roles, and so on
-
Favorites: One-click access to bookmarked entities
-
Home Page: Your personal landing view with activity feed, recent items, notifications, and other widgets (depends on installed plugins and enterprise configuration)
-
Global search (accessible from Home Page): Find anything across the platform and connected sources: internal, external (e.g., ChEMBL), or general knowledge (e.g., Wikipedia). Search by keywords or tags, registered identifiers, or ask natural language questions like "how do I...?" or "bioactivity for Shigella"
-
Routing: Bookmark and access the exact view states using URLs (e.g., a dashboard with filters set to a specific country)
Browse tree
The Browse view (opened from the Sidebar) is the main entry point to everything on the platform. For how the Browse view itself looks and behaves, see Browse. This section focuses on what you see in the tree.
- My stuff
- Spaces
- Apps
- Files
- Dashboards
- Databases
- Platform
| My stuff is your personal project - your private folder. Anything you create or upload without choosing a specific project goes here, along with items others have shared with you. The tree offers multiple ways to access this content: Recent, Favorites, Shared with me (grouped by sharing user), and item type-based groups like My Dashboards, My Files, etc. |
| Spaces organize items into shared "folders" (projects, teams, departments, clients, etc.). Access permissions are set at the space root level and inherited by contents. Moving an entity between spaces changes both its location and who can access it. Learn more about Spaces |
| Apps shows installed applications (e.g., Tutorials, HitDesign, MolTrack). Apps appear here after installation from the plugin repository (see the Platform tab). |
| Files is a file browser for your connected file storage. The tree is organized into several views: My files, Spaces (files belonging to individual projects), App Data (files bundled with installed apps, e.g., clinical studies for Clinical Case), and Demo (sample files for exploring platform capabilities on Datagrok's public instance). |
| Dashboards shows all dashboards available to you - your own plus those shared with you, subject to permissions. |
| Databases shows all connections available to you. At the top level, you see each connected database. Expanding a database shows its contents: connections, tables and their columns, and any saved queries. To explore structure and relationships visually, use the Schema Browser (right-click a connection and choose Browse schema). |
| Everything above Platform represents end-user work (your data, projects, apps, and analyses). Everything inside Platform defines how your Datagrok instance operates: its extensions, configuration, security model, and the components from which UI and workflows are built (see Design principles). This is where platform admins and power users add and manage plugins, functions, API integrations, access control, runtime environments, and other assets that support the rest of the platform. |
Datagrok entities vs. files
In Browse, files appear alongside other objects in the tree. While looking similar, files are fundamentally different.
Most items in Browse are entities (e.g., dashboards, queries, connections, users, and so on). Entities are native Datagrok objects stored inside Datagrok's database with full metadata. Because of that, they all support the same operations: bookmarking, access control and sharing, version history, etc.
Files, by contrast, live outside Datagrok. The Files section in Browse points to external storage (file shares, cloud buckets, S3, your Datagrok server, etc.). When you open a file, Datagrok interprets its contents on the fly - tabular files become temporary dataframes, images or protein structures open in viewers, etc. For tabular data, you can then save the temporary dataframe as a Datagrok entity (a table or dashboard). You can also add files to Datagrok projects so they inherit project-level permissions. In all cases, the original file remains external. This is why certain actions available for entities may not be available for files, even though both appear in the Browse tree.
Favorites
Add any entity to favorites for quick access. There are several ways to favorite an item:
- Right-click the entity and select Add to Favorites
- On the Sidebar, click the Favorites icon (). This opens the Favorites Panel. Drag the entity directly into it.
- Open the Favorites view (Browse > My Stuff > Favorites) then drag an entity from the tree directly into the view.
Access favorites from either the Favorites Panel (toggle from Sidebar), Context Panel (click the star icon in the header), or directly from Browse > My Stuff > Favorites.
To remove an item from favorites, click the item, then click the star icon next to its name in the Context Panel. The star changes from orange to clear, indicating the item is no longer favorited.
Home Page
When you first log in (or when you click the Home () icon on the Browse's Top Menu), Datagrok opens the Home Page, a landing view that combines global search with a set of customizable widgets.
At the top is the global search bar, your entry point for searching across Datagrok and connected external sources (see global search). As soon as you start typing, the widget area is replaced with live search results.
When the search bar is empty, Datagrok shows widgets. Widgets surface information or shortcuts supplied by your installed plugins. For example, activity summaries, learning resources, usage insights, or domain-specific tools. What you see depends entirely on how your instance is configured.
To customize the visibility of available widgets, click Customize widgets... at the bottom of the Home Page. This opens the Context Panel where you can enable or disable widgets using checkboxes.
Global search
When you type in the global search bar (accessible from the Home Page), Datagrok routes your query through several mechanisms at once:
-
Metadata-based entity search: Finds platform entities by name, description, tags, parameters, and properties. This is deterministic, exact matching. Datagrok searches over what it knows about the objects it stores.
Entity search patterns
Looks for 'biologics' in title and description:
BiologicsTagged as #demo:
#demoTagged as either either #demo or #chem:
#demo or #chemCreated in the last 7 days:
createdOn > -1wComplex conditions:
(#demo and #chem) or author = "john@google.com"
starredBy = @current or author = @current
Created by recently joined users:
author.joined > -5dTo apply multiple filters, use
ANDandORoperators and parentheses. -
Pattern-based identifier search: Developers can register custom identifier patterns (e.g.,
CHEMBL\d+for ChEMBL compound IDs). When a query matches a registered pattern, Datagrok recognizes the identifier, queries connected data sources, executes relevant functions, and shows the results accordingly (e.g., as info cards or as info panes in the Context Panel). -
Natural language search patterns: Pro users can define natural language search patterns for functions (e.g.,
bioactivity for ${target}). Searching for "bioactivity for Shigella" automatically executes the function (e.g., runs a query) with "Shigella" as the parameter. -
LLM-powered interpretation and orchestration (in Beta): Adds intelligence on top of deterministic search. The LLM interprets natural-language questions, normalizes fuzzy input, searches documentation, and orchestrates function execution and chaining.
Search respects your access permissions. You only see results for items you are allowed to access. For external sources, search uses platform-level API credentials or public endpoints. Results availability depends on your instance's configuration.
Routing
Datagrok assigns a unique URL to every view, file, or entity. This means you can:
- bookmark these URLs for quick access later
- copy them from your browser to share with colleagues
- build links into documentation or reports
- navigate programmatically via the API.
When you open these links, Datagrok loads the applicable view and restores any state encoded in the URL (such as filters in a Table View or specified parameters in query output), subject to permissions.
URL patterns
Dashboards
Dashboards use this URL pattern:
https://<your-instance>/p/{namespace}.{project-name}/{view-name}
Where:
namespace: Namespace containing the dashboard (e.g.,demo)project-name: Project name (e.g.,pic50)view-name: Optional. Specific Table View within the project
Example:
https://public.datagrok.ai/p/demo.pic50/desc_canvas_aug30
This opens the pic50 dashboard in the demo namespace and displays the
desc_canvas_aug30 Table View. If you omit the Table View name, Datagrok opens the
project's first Table View.
Files
File shares are addressable by URL using this pattern:
https://<your-instance>/files/{namespace}.{share-name}/{path}
Examples:
https://public.datagrok.ai/files/demo.testjobs.files.demofileshttps://public.datagrok.ai/files/demo.testjobs.files.demofiles/chem/zbb
File share URLs support nested directories, so you can bookmark any folder depth directly. The second example opens the zbb folder inside the chem directory of the demofiles file share.
Parameterized queries
Saved queries can be executed directly from URLs:
https://<your-instance>/q/{namespace}.{connection}.{query}?param1=value1¶m2=value2
Example:
https://public.datagrok.ai/q/Demo.CoffeeCompany.StoresInState?state=NY
This executes the StoresInState query with state=NY and displays the
results. All query parameters are passed as URL query string arguments.
Note: Applications exposed as entities (under
/apps) can be opened via URL like other entities. Any additional app-specific routing beyond the base URL depends on how the app is implemented.
Next steps
Now that you understand the UI and navigation:
- You can start working with data: Table View
- Learn about project organization: Spaces
- Try common tasks: Basic tasks
- Learn more about core platform concepts (entities, functions, etc.): Core concepts