Develop custom cell renderers
Datagrok provides an opportunity to use custom visualization for cells in data
grid/table. This could be done by defining a function annotated with special
comments. It should take no args, return an instance of class derived from DG.GridCellRenderer, and have at least
two tags: cellRenderer and cellRenderer-<type> (specify the cell type here). This is it!
The following example defines a cell renderer for summary column visualized as bar chart. This is real code from the "PowerGrid" public package.
//name: piechartCellRender
//tags: cellRenderer
//meta.cellType: piechart
//meta.virtual: true
//output: grid_cell_renderer result
export function piechartCellRenderer() {
  return new PieChartCellRenderer();
}
If you are on version ^4.12.x of datagrok-tools, you can use class decorators to register cell renderers:
@grok.decorators.cellRenderer({
  cellType: 'piechart',
  virtual: true,
})
export class PieChartCellRenderer extends DG.GridCellRenderer {
  /* PieChartCellRenderer contents */
}
This is equivalent to adding a function to package.ts. There is no need to add anything other than the class itself.
When you run the build script for your package, the webpack plugin called FuncGeneratorPlugin will add a special
package.g.ts file to your project. Note that it is not on the ignore list, so you are supposed to commit this file.
Renderer class derived from DG.GridCellRender must implement name and cellType properties, the main drawing
method render, and optional renderSettings methods allowing to build UI HTML Element for renderer settings.
An example is
available "PowerGrid" public package
.
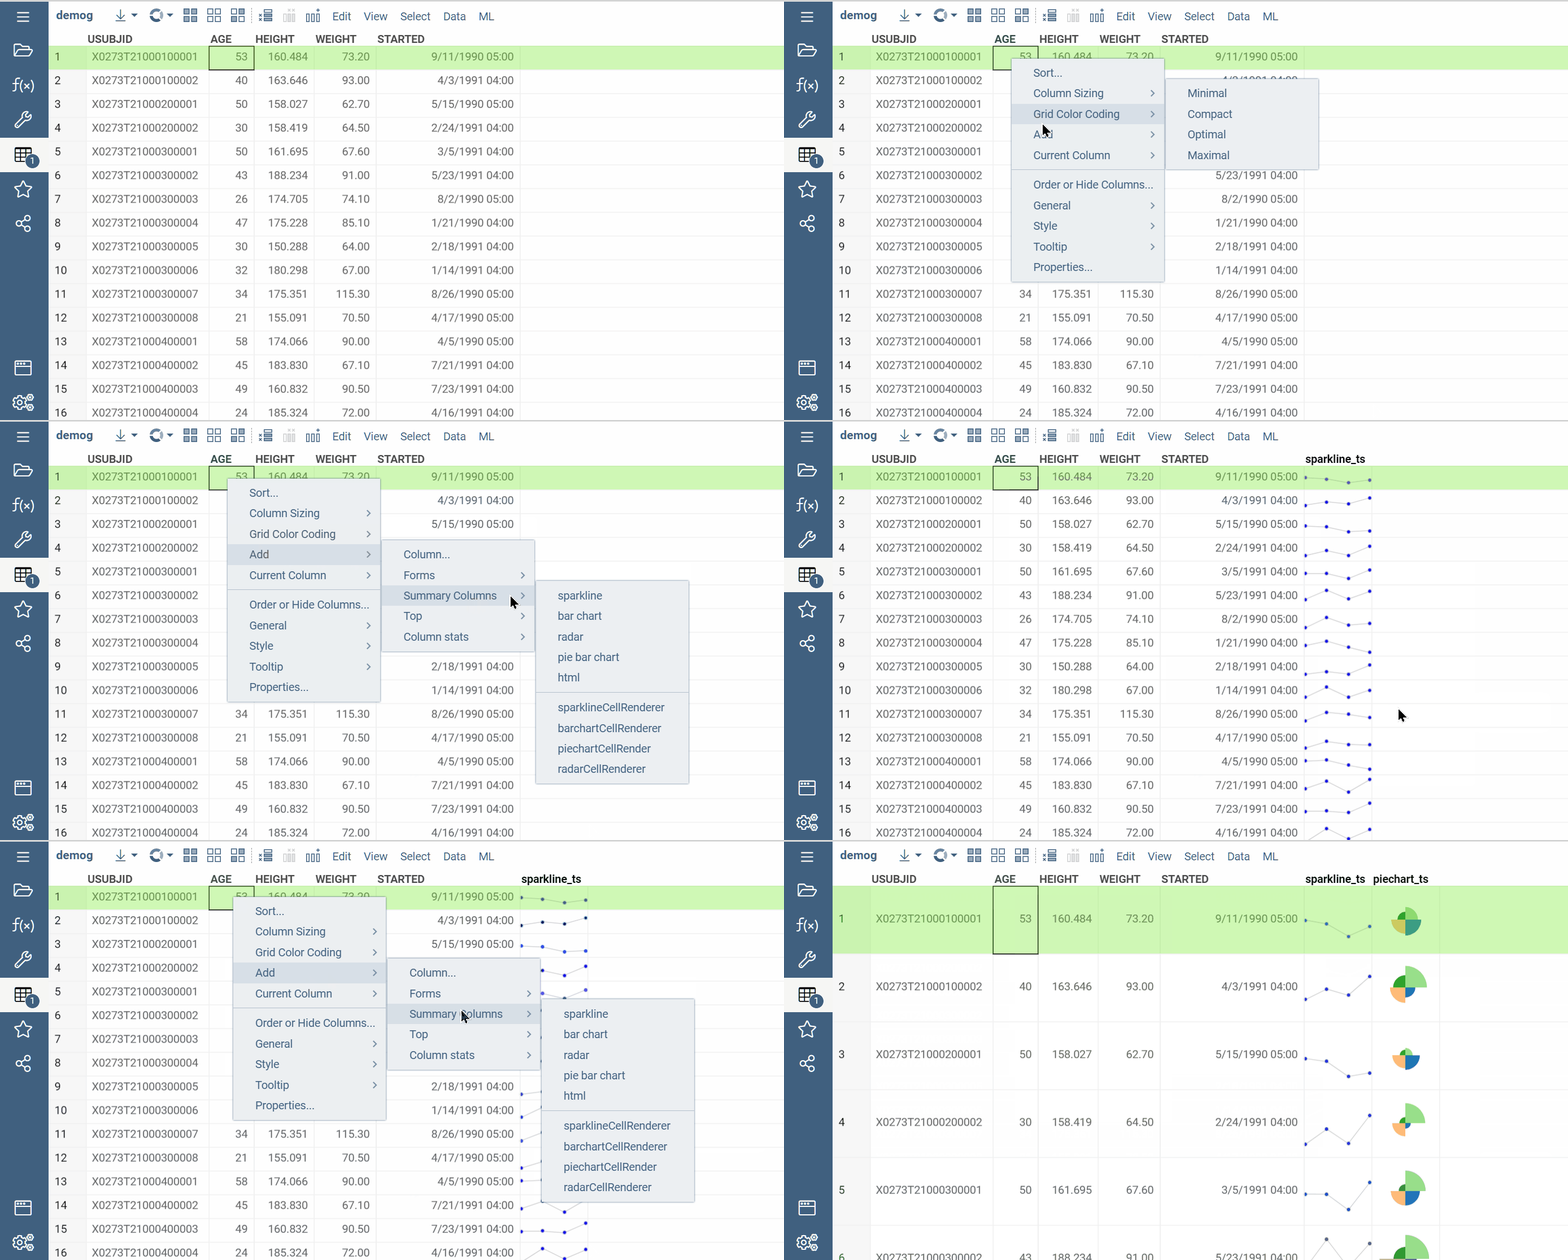
Once a package containing that function is published, the platform will automatically create the corresponding renderer when user creates a summary column of specified type. Here is how it looks:

See also: