Exploratory data analysis
We help you explore at the speed of thought. Learn what makes it possible.
The goal of data analysis is to derive knowledge. To learn from data, we need to understand it. For large, complex datasets, conventional tools like tables and stats aren't enough. To recognize patterns and anomalies, we must leverage our ability to process information visually.
For this kind of analysis, we need tools that let us quickly test hypotheses and validate assumptions. We need the ability to slice and dice data, switch contexts, zoom, aggregate, focus, and access information as needed. In other words, we need interactivity, flexibility, and speed.
Datagrok delivers exactly that. It works with millions of columns and billions of rows and lets you explore at the speed of thought. Imagine loading the entire ChEMBL database (2.7 million molecules) in your browser, searching substructures, sketching, filtering, visualizing, and interactively exploring the chemical space. Datagrok makes it possible.
What's more, Datagrok understands the nature of your data, offering actionable insights. It can suggest suitable visualizations for your datasets, automatically render chemical structures, calculate descriptors, or predict properties. It gives you every tool you need to explore data and uncover its meaning.

- Bring data from anywhere. Your data is automatically parsed and rendered in a spreadsheet. The spreadsheet works with millions of columns and billions of rows and has powerful features:
- Built-in statistics and dataset overview
- Custom cell renderers, including for domain-specific data (like molecules, sequences, or dose-response curves)
- Summary columns and sparklines
- Editable rows, and more.
- Wrangle data right from your visualization workspace. Cluster data, impute missing values, find and treat duplicates and outliers.
- Use statistical functions to perform calculations.
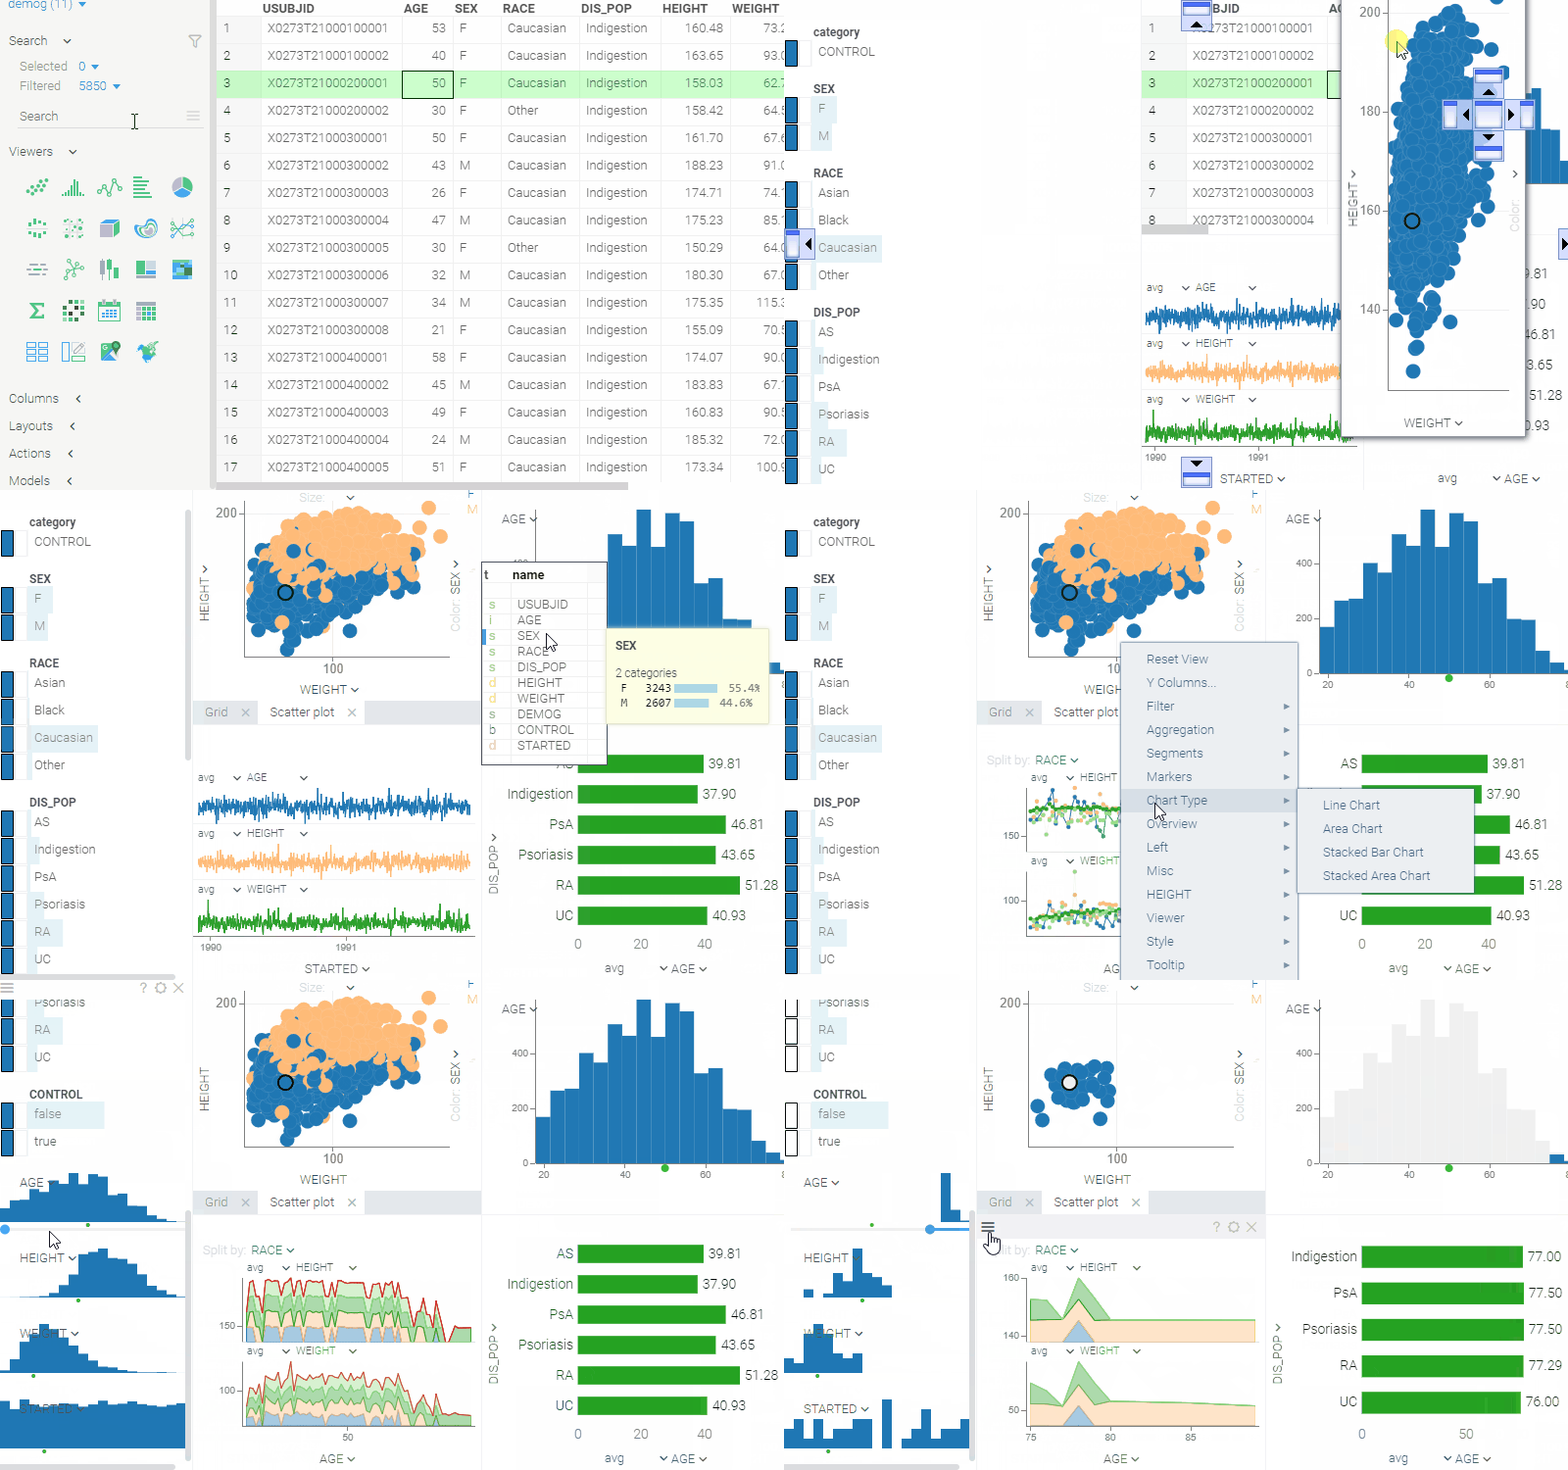
- Slice and dice data with 50+ interactive viewers. We support all popular visualizations (like scatterplots with built-in regression lines or box-plots with built-in statistical tests) and certain domain-specific viewers. The viewers also support domain-specific value renderers like molecules on scatterplot axes and points.
- Filter, zoom, aggregate, pivot, and cross-link data on the fly. All our viewers are synchronized, high-performant, and interactive.
- Seamlessly access information with widgets and context-driven info panes.
- Create dashboards in seconds. Share your analysis in easy and secure way: send a URL link or integrate: REST API, JS API, or embed as an iframe.
- Use data annotations and team discussions to collaborate on decision-making.
Need a specific tool or functionality? Easily add custom viewers or develop new functions in R, Python, or Julia.
Learn more about capabilities here.
Resources
Interactive Data Visualization
An overview of some of the visualization capabilities of the Datagrok platform, including the concepts of views, viewers, selection, filter, and layouts.
Coffee Company
How do we choose the best location for a new coffee place, given the historical sales data? Datagrok to the rescue! In less than 20 minutes, we achieve the following:
• Retrieve historical data from the Postgres database
• Explore, visualize, and clean the dataset
• Impute missing values
• Extract census data from the long/lat coordinates
• Perform multivariate analysis
• Build multiple predictive models, and assess their performance
• Build an interactive map for predicting sales
• Deploy the results as an app to all users in our company