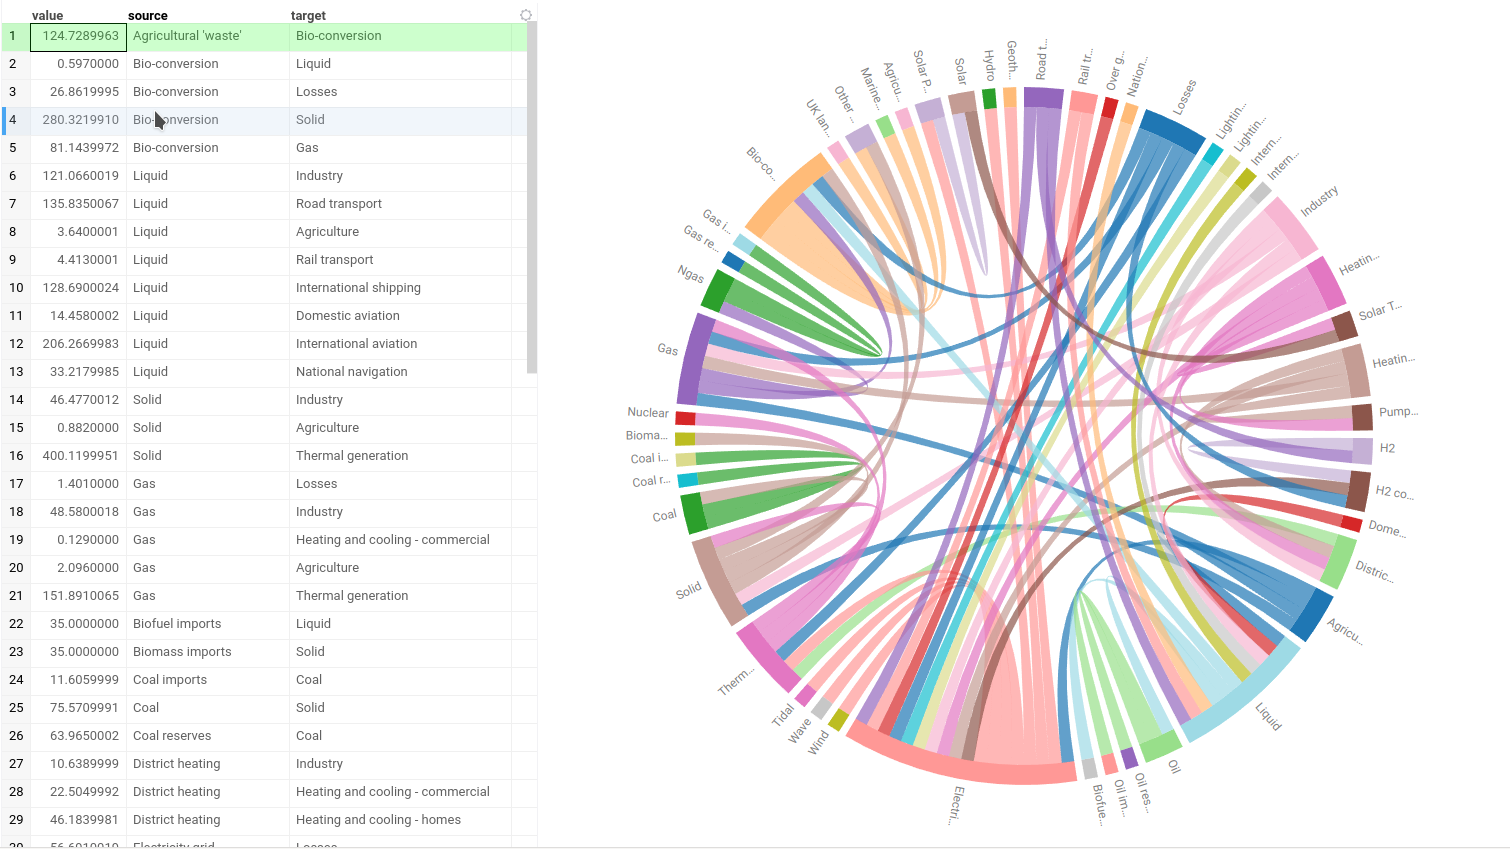
Chord
A chord diagram is a graphical method of displaying the inter-relationships between data. You can use it to visualize complex networks or flows between different entities. A chord diagram arranges data radially around a circle and draws the flows between the data points as arcs connecting the data. The chord width represents the strength of the flow between the entities.
Creating a Chord viewer
To create a Chord viewer, navigate to the Main Menu and select Add > Javascript Viewers > Chord.
Developers: To add the viewer from the console, use:
grok.shell.tv.addViewer('Chord')
When you add a chord viewer in Datagrok, the platform selects three columns:
- A categorical "From" column
- A categorical "To" column
- A numeric "Chord length" column representing the flow strength between source and target categories.
Datagrok uses several heuristic rules to select the most appropriate columns. Both "From" and "To" columns should contain same categorical values. Additionally, Datagrok can utilize column names such as "source," "target," and "value" as hints to identify appropriate columns.
Configuring a Chord viewer
You can set the "Source," "Target," and "Chord length" columns, and customize visualization options. To do that, click the Gear icon on top of the viewer and use the Data and Misc info pane on the Context Panel to manage the viewer's settings.
For example, you can:
- Select the aggregation type for connections via Agg type control. The possible modes are to count the connections or to sum the "Chord length" values.
- Set the connection color mode by source or by target via Color by control.
- Change the sorting order of the categories via Sort by control.
- Set the direction of categories via Direction option.
- Show or hide categories without connections by selecting Include nulls checkbox.
Interaction with other viewers
The chord viewer responds to data filters but row selection is limited. Clicking a connection or category in the viewer selects the corresponding rows in the grid. However, selecting rows in the grid or other viewers doesn't impact the representation of the chord viewer.
Viewer controls
| Action | Control |
|---|---|
| Select all rows containing the category | Click the category |
| Select row containing connection between two categories | Click on the connection |
| Add connection/category to selection | Shift+click the connection/category |
| Toggle connection/category selection | Ctrl+click the connection/category |