Treemap
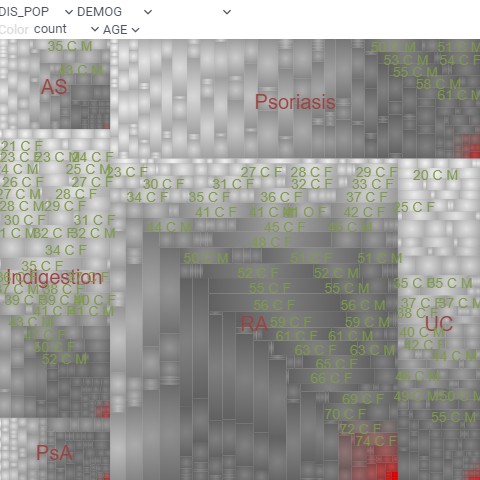
Treemap displays hierarchical (tree-structured) data as nested rectangles. The
branches are rectangles, then tiled with smaller rectangles representing
sub-branches. Rectangles have areas proportional to a specified dimension of the
data using the specified aggregation function (count by default).
Treemap displays all data simultaneously and shows a part-to-whole relationship among many categories. Use a treemap to spot irregularities or patterns.

Adding
- Go to Tables and expand the Viewers panel.
- Locate the Treemap icon and click it.
Developers: To add the viewer from the console, use:
grok.shell.tv.addViewer('Treemap');
Initially, the viewer picks up the first categorical column in the corresponding table and builds a treemap.
Settings
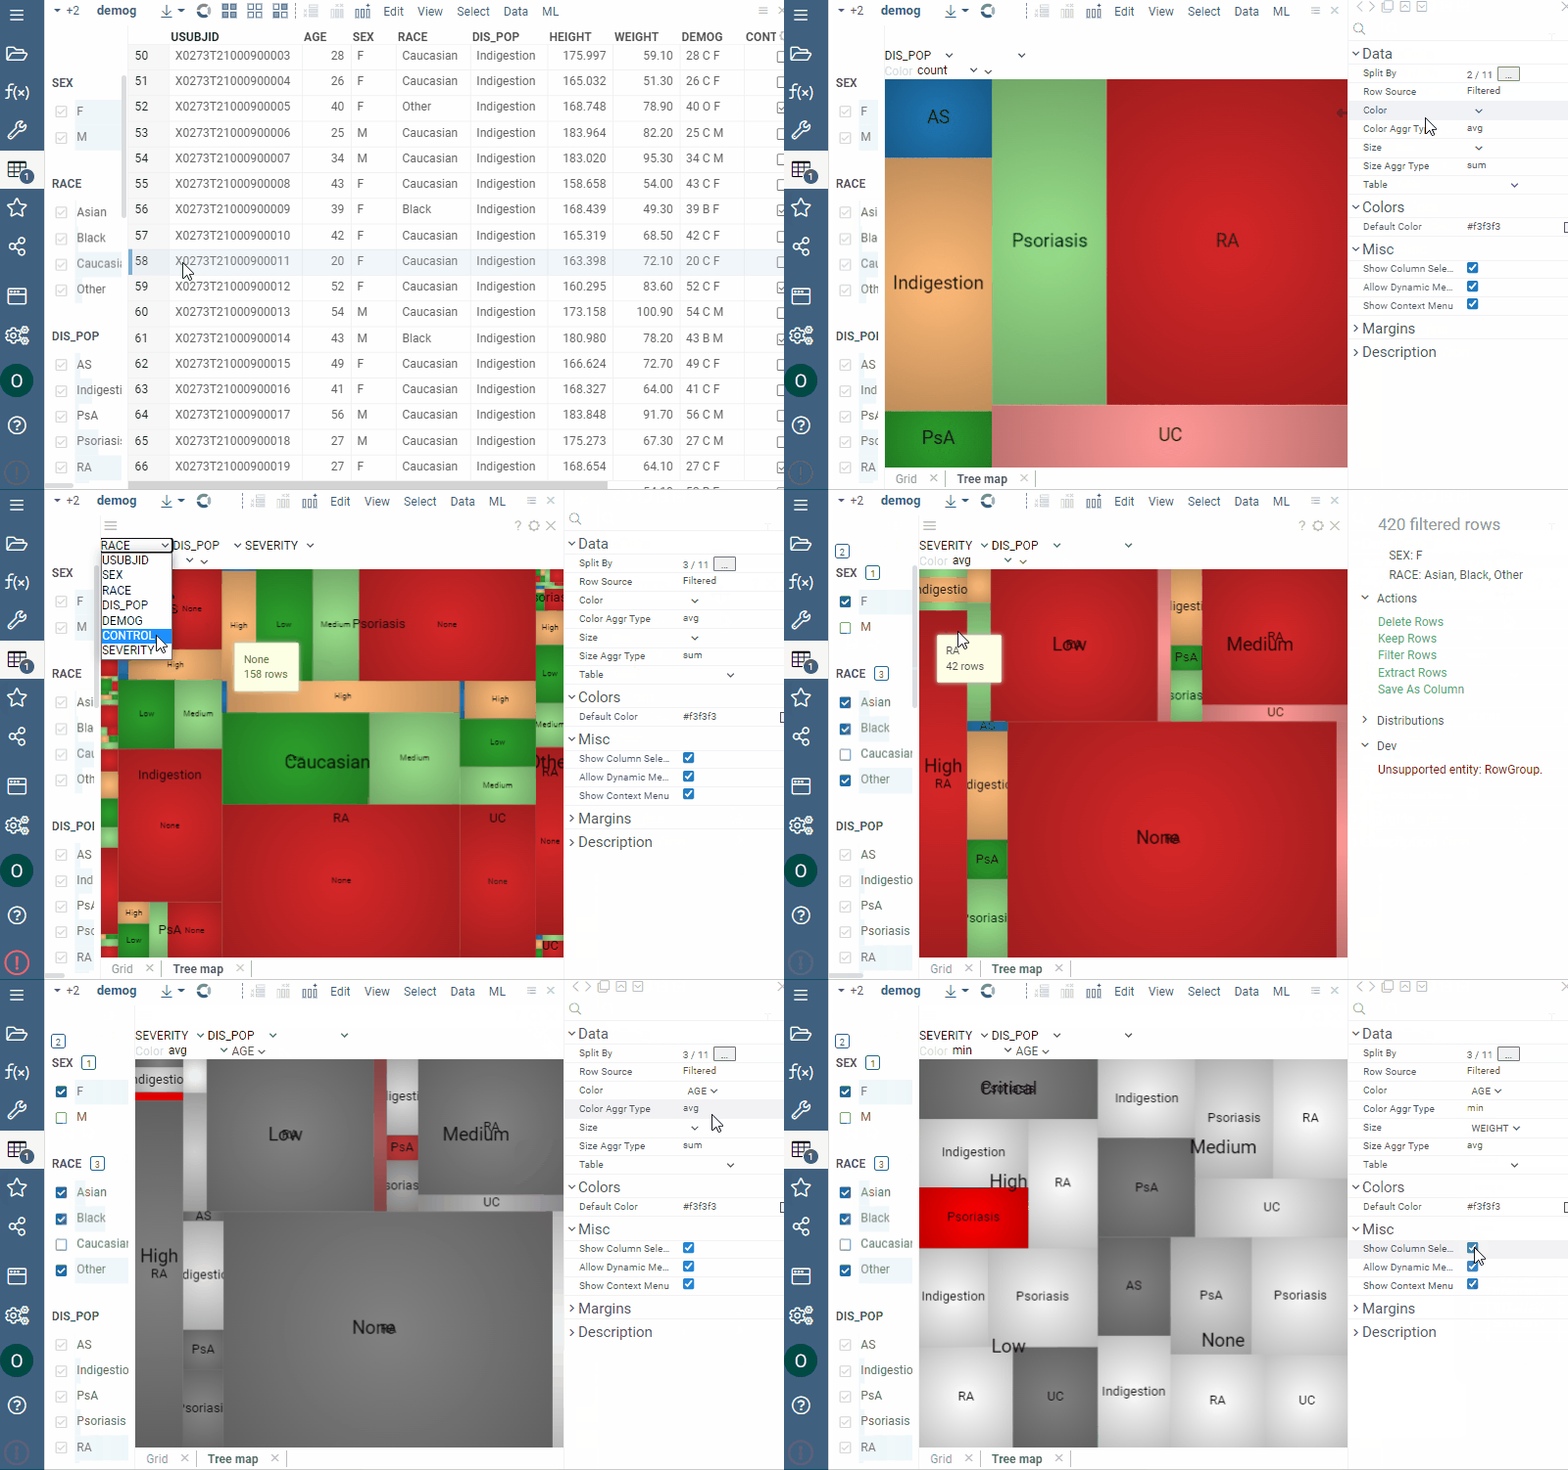
You can set the hierarchy and customize a treemap viewer. To do that, click the Gear icon on top of the viewer and use settings on the Context Panel. For example, you can:
- Set tree hierarchy
- Choose the desired column using the drop-downs on top of the viewer.
- Or, edit the
Split byproperty (drag-and-drop columns to change their order).
- Select the rows for the treemap display using the Row source dropdown list.
- Size-code nodes using
SizeandSize Aggr Typeproperties. - Color-code nodes using
ColorandColor Aggr Typeproperties.
Interactivity
- Shows a subset of rows specified by the
Row Sourceproperty - Shows selected rows in orange
- Synchronizes current record upon clicking on the point
- Click on the rectangle selects rows

Viewer controls
| Action | Control |
|---|---|
| Add node to selection | Shift+click the node |
| Toggle node selection | Ctrl+click the node |
Properties
| Property | Type | Description |
|---|---|---|
| General | ||
| Split By Column Names | list | |
| Color Column Name | string | |
| Color Aggr Type | string | |
| Size Column Name | string | |
| Size Aggr Type | string | |
| Default Color | number | |
| Show Column Selection Panel | boolean | |
| Outer Margin Left | number | |
| Outer Margin Right | number | |
| Outer Margin Top | number | |
| Outer Margin Bottom | number | |
| Row Source | string | Determines the rows shown on the plot. |
| Allow Dynamic Menus | boolean | |
| Show Context Menu | boolean | Properties common for all viewers todo: use code generation |
| Title | string | |
| Description | string | Viewer description that gets shown at the Descriptor Position. Markup is supported. |
| Help | string | Help to be shown when user clicks on the ''?'' icon on top. Could either be in markdown, or a URL (starting with ''/'' or ''http''). |
| Description Position | flexposition | |
| Description Visibility Mode | visibilitymode | |
| Style | ||
| Auto Layout | boolean | |
| Controls Font | string | Viewer controls elements font. |
| Data | ||
| Filter | string | Formula that filters out rows to show. Examples: ${AGE} > 20 or ${WEIGHT / 2)} > 100, ${SEVERITY} == ''Medium'', ${RACE}.endsWith(''sian'') |
| Table | string | |
| Description | ||
| Show Title | boolean |
