Sankey
A Sankey plot is a type of flow diagram that visualizes the distribution and proportional relationships between different categories within a dataset. It uses directed arrows, or "flows," whose widths are proportional to the flow quantity, effectively illustrating the magnitude of connections between entities. This visualization is particularly useful for displaying energy flows, material transfers, or financial transactions, providing clear insights into how resources or values move through a system.
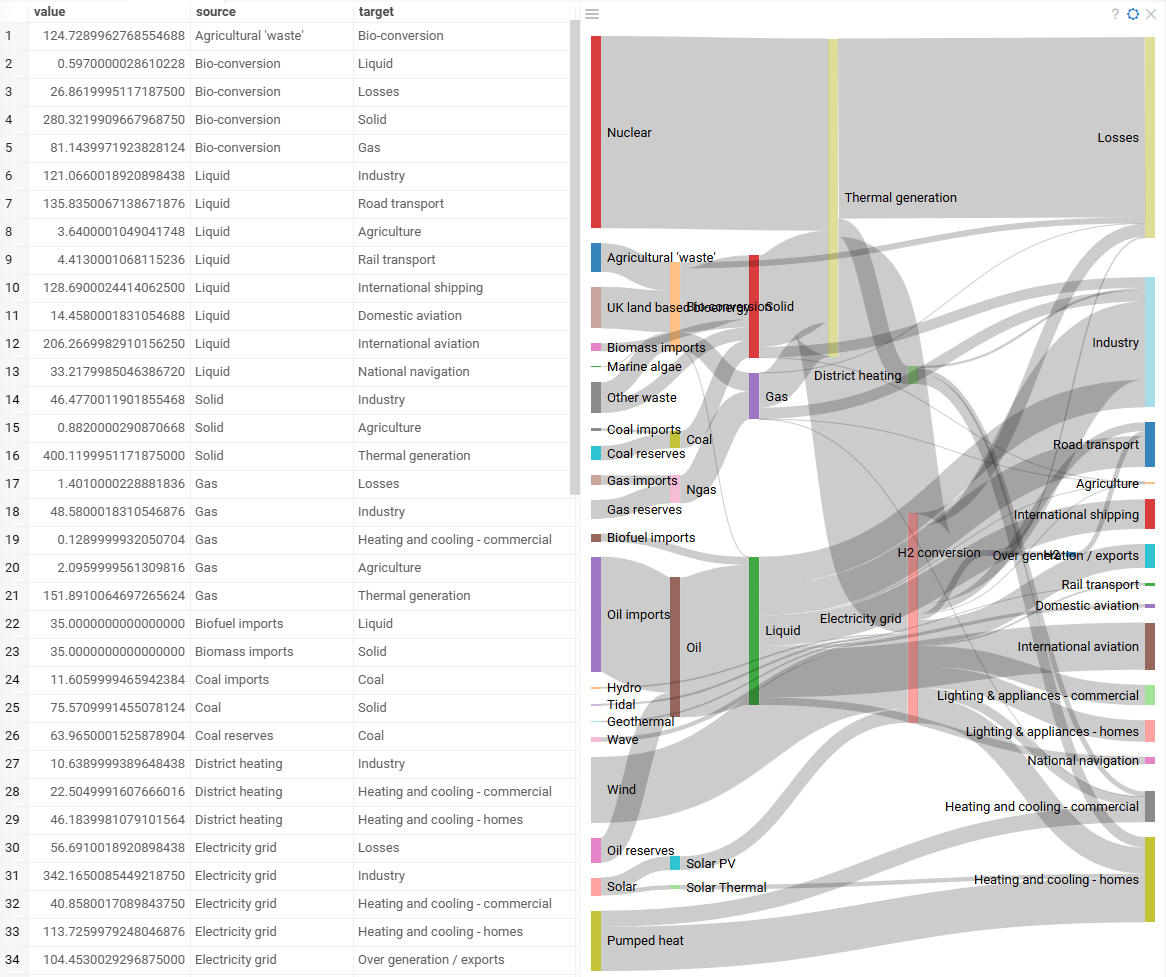
Creating a Sankey viewer
To create a Sankey viewer, navigate to the Main Menu and select Add > Javascript Viewers > Sankey.
Developers: To add the viewer from the console, use:
grok.shell.tv.addViewer('Sankey')
When you add a sankey viewer in Datagrok, the platform selects three columns:
- A categorical "Source" column
- A categorical "Target" column
- A numeric "Value" column representing the flow strength between source and target categories.
Datagrok uses several heuristic rules to select the most appropriate columns. The "Source" and "Target" columns should contain categorical values representing entities between which flows exist. They do not have to be identical but must be relevant to the flow structure. Additionally, Datagrok prioritizes column names such as "source", "target", and "value" when auto-detecting inputs.
Configuring a Sankey viewer
You can set the "Source", "Target", and "Value" columns. To do that, click the Gear icon on top of the viewer and use the Data and Misc info pane on the Context Panel to manage the viewer's settings.
Interaction with other viewers
The sankey viewer responds to data filters but row selection is limited. Clicking a connection or category in the viewer selects the corresponding rows in the grid. However, selecting rows in the grid or other viewers doesn't impact the representation of the sankey viewer.
Viewer controls
| Action | Control |
|---|---|
| Select all rows containing the category | Click the category |
| Select rows connected by a flow between two categories | Click on the connection |
| Add connection/category to selection | Shift+click the connection/category |
| Toggle connection/category selection | Ctrl+click the connection/category |