Shape map
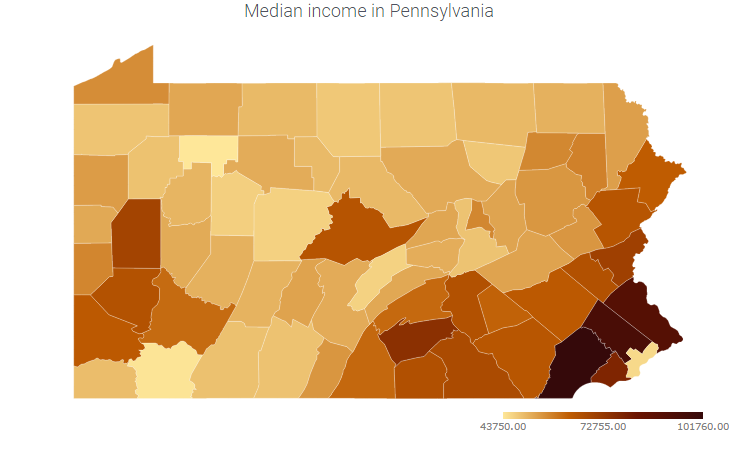
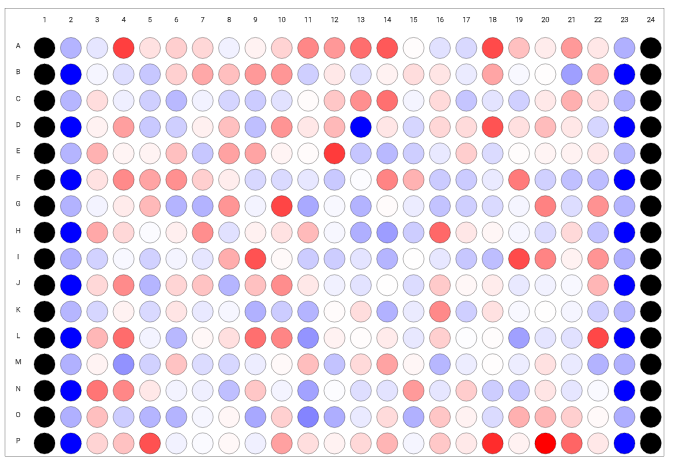
Shows a map that is applicable for the specified dataset. Typically, it would represent a geographical area (countries, states, counties, etc), but it also supports arbitrary shapes (such as a store floor plan, brain regions, or EEG electrodes).
When opened, a viewer automatically determines the best map that is applicable to the current dataset. If more than one map fits the data, it is chosen arbitrarily; right-click and choose the one you want from the pop-up menu.
Geographical regions can be represented by different names (such as Pennsylvania and PA), and there is an elaborate system in place that understands synonyms and abbreviations. However, sometimes it can't map names to the regions. To identify these records, select "Select not matching rows" from the popup menu.


Videos
See also:
- Applicable tables: #{x.demo:germany_grp_by_state}, #{x.demo:pa_income_by_county}, #{x.demo: ua_population}
- Viewers
- JS API: Shape map
