Radar viewer
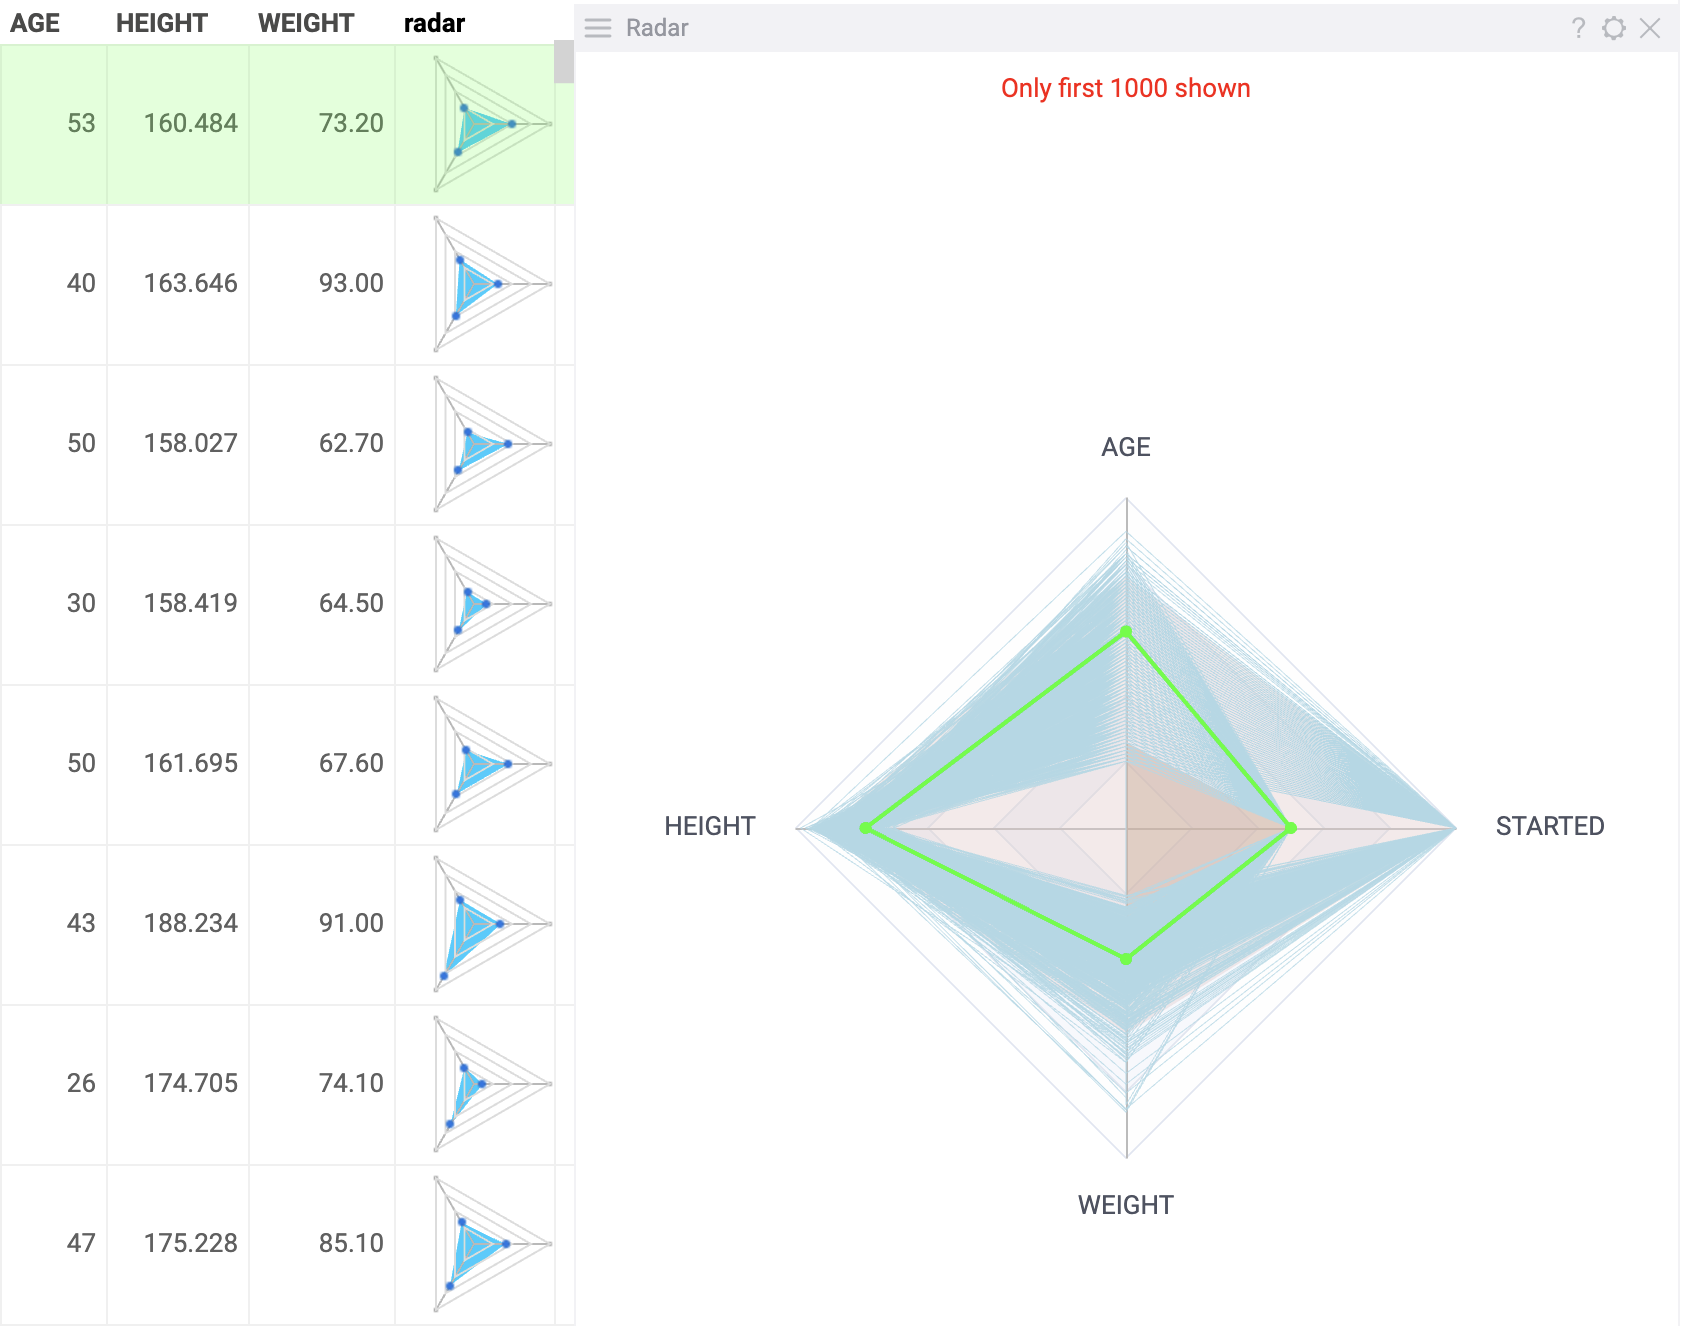
Radar viewer (a spider chart) compares multivariate data across several dimensions. It plots numerical values of the table columns on axes that radiate out of a center: the higher the value, the further it is from the center. The values from the same table row are connected across axes with lines.
With a radar viewer, you can compare the numerical values of different columns within a row and compare rows' values within a dataset. Radar viewers are commonly used for comparison, decision-making, and analysis, for example, in elemental analysis in cheminformatics.
You can use a radar viewer as a standalone chart or as an inline viewer in summary column of grid.
Note: To use a radar viewer, install the package Charts.
Add a radar viewer
- As a standalone viewer:
- On the menu ribbon, click the Add viewer icon. A dialog opens.
- In the dialog, select Radar viewer.
- As an inline viewer:
- Right-click a grid viewer. The context menu appears.
- Select Add > Summary columns > Radar.
Developers: To add the viewer from the console, use:
grok.shell.tv.addViewer('Radar');
Initially, a radar viewer selects the first 20 numerical columns from the corresponding table and displays up to 1000 rows, along with the current row. Percentiles (5th and 95th) can be toggled on or off and are represented as color-filled areas across the axes. Both the colors and values of these percentiles can be configured for better visualization.
Configuring a radar viewer
To configure a radar viewer, click the Gear icon on top of the viewer and use the Misc and Color info panels on the Context Panel.
For example, you can:
- Set the min and max percentiles by selecting their values from the Min and Max dropdown lists.
- Toggle the display of percentiles using the Show Min and Show Max checkboxes.
- Set the background color for the percentiles' areas using the Background Min Color and Background Max Color options.
- Toggle value labels on or off with the Show values checkbox.
- Configure the color for the current row using the Current Row Color setting, as well as Mouse Over Row Color for highlighting rows under the cursor.
- Control the visibility of key elements with the Show Current Row, Show Mouse Over Row, and Show Mouse Over Row Group options.
Interaction with other viewers
A radar viewer responds to current row selection but does not respond to data filters.