Pie chart
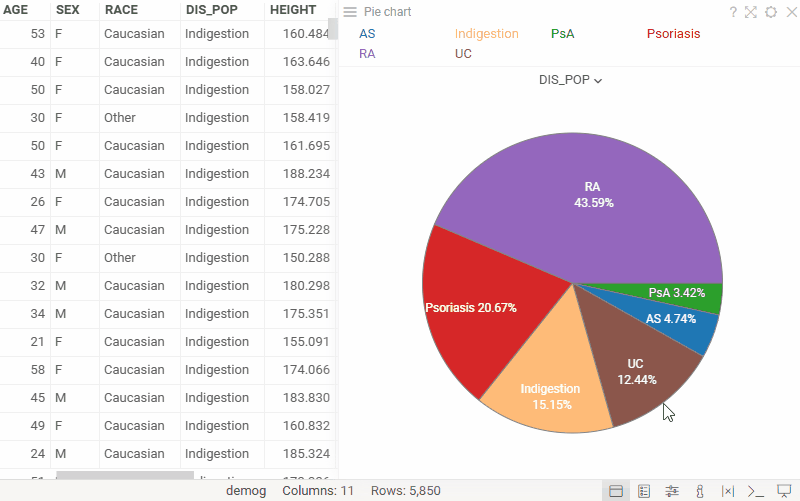
A pie chart shows numerical proportions across categories. Like a bar chart, it compares categorical values, but emphasizes the relative size of each category (a slice of the pie) compared to the whole dataset.
developers
To add the viewer from the console, use:
grok.shell.tv.addViewer('Pie chart');
Controls:
| Right click | Context menu |
| Alt+F | Show in full screen |
| Segment click | Select segment |
Videos

Properties
| Property | Type | Description |
|---|---|---|
| General | ||
| Category Column Name | string | |
| Segment Angle Column Name | string | |
| Segment Angle Aggr Type | string | |
| Segment Length Column Name | string | |
| Segment Length Aggr Type | string | |
| On Click | string | Action to be performed when you click on a pie |
| Start Angle | number | |
| Max Radius | number | |
| Shift | number | |
| Outline Line Width | number | |
| Back Color | number | |
| Outline Color | number | |
| Mouse Over Outline Color | number | |
| Inner Label Color | number | |
| Missing Value Color | number | |
| Show Label | boolean | Show the label (text or image) inside the pie. |
| Show Percentage | boolean | Show the percent value inside the pie. |
| Show Value | boolean | Show the number of values inside the pie. |
| Show Column Selector | boolean | |
| Show Mouse Over Row Group | boolean | Highlight part of the pie that corresponds to the mouse-over rows |
| Margin Left | number | |
| Margin Top | number | |
| Margin Right | number | |
| Margin Bottom | number | |
| Legend Visibility | visibilitymode | |
| Legend Position | flexautoposition | |
| Row Source | string | Determines the rows shown on the plot. |
| Allow Dynamic Menus | boolean | |
| Show Context Menu | boolean | Properties common for all viewers todo: use code generation |
| Title | string | |
| Description | string | Viewer description that gets shown at the Descriptor Position. Markup is supported. |
| Help | string | Help to be shown when user clicks on the ''?'' icon on top. Could either be in markdown, or a URL (starting with ''/'' or ''http''). |
| Description Position | flexposition | |
| Description Visibility Mode | visibilitymode | |
| Data | ||
| Category Map | string | Category time unit map function (applicable to dates only). |
| Pie Sort Type | string | |
| Pie Sort Order | string | |
| Include Nulls | boolean | |
| Filter | string | Formula that filters out rows to show. Examples: ${AGE} > 20 or ${WEIGHT / 2)} > 100, ${SEVERITY} == ''Medium'', ${RACE}.endsWith(''sian'') |
| Table | string | |
| Style | ||
| Label Position | string | |
| Auto Layout | boolean | |
| Controls Font | string | Viewer controls elements font. |
| Selection | ||
| Show Selected Rows | boolean | Highlight selected rows |
| Description | ||
| Show Title | boolean |
See also: