Surface plot
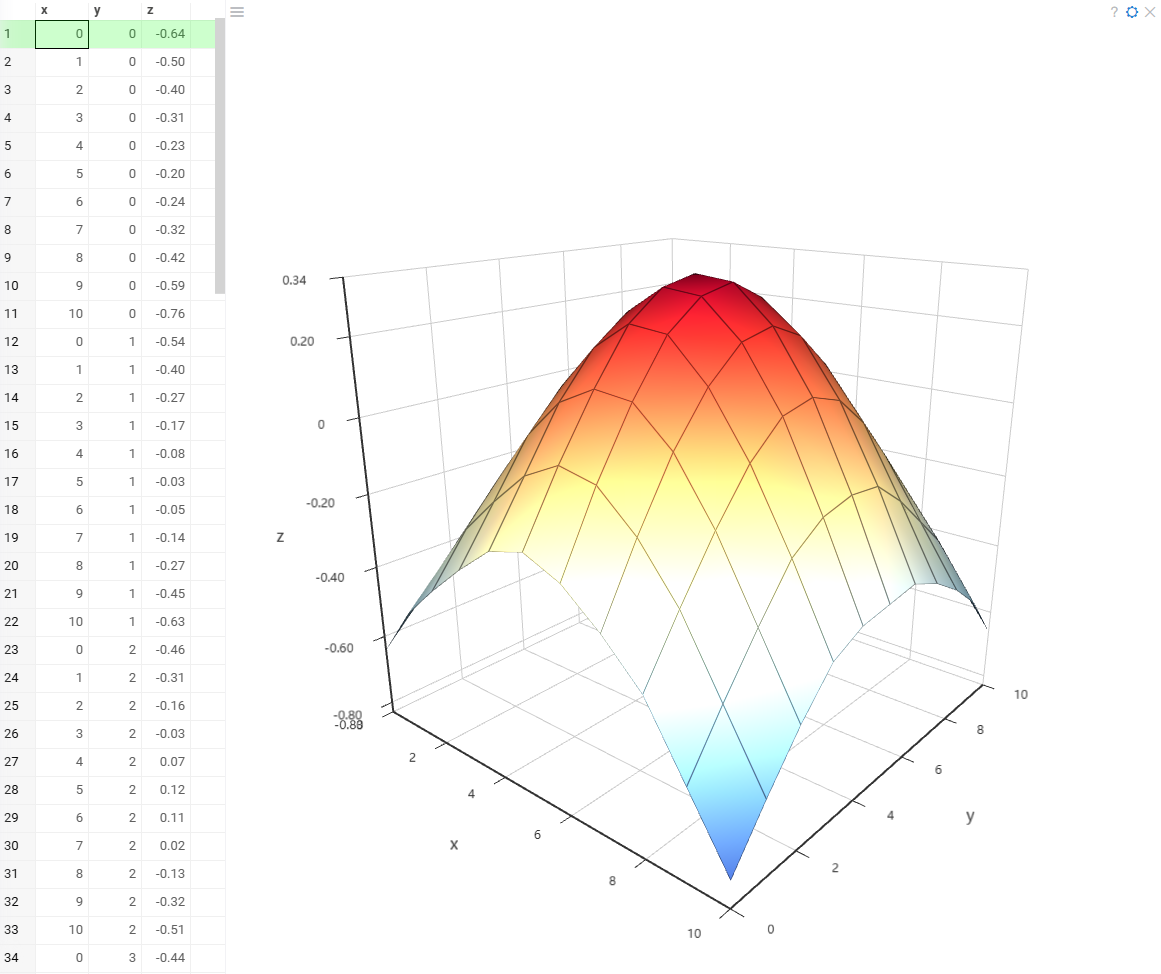
A Surface plot is a 3D visualization that shows how three continuous variables interact within a dataset. It displays data as a smooth or faceted surface where the X and Y axes define the independent variables, and the Z axis represents the dependent variable.
This visualization is particularly useful for:
- Topographical mapping – representing elevation or terrain data.
- Mathematical functions – visualizing 3D functions and their variations.
- Scientific and engineering data – analyzing heat distribution, fluid dynamics, or other continuous data relationships.
The surface plot allows users to identify patterns, peaks, and valleys within a dataset, making it a valuable tool for understanding complex three-dimensional relationships.
Creating a Surface plot
To create a Surface plot viewer, navigate to the Main Menu and select Add > Javascript Viewers > Surface plot.
Developers: To add the viewer from the console, use:
grok.shell.tv.addViewer('Surface plot')
When you add a surface plot in Datagrok, the platform automatically detects three numerical columns: X and Y as independent variables and Z as the dependent variable. If the detection is incorrect, you can manually set them in the viewer settings.
Configuring a Surface plot
You can set the "X", "Y", and "Z" columns, and customize visualization options. To do that, click the Gear icon on top of the viewer and use the Data and Misc info pane on the Context Panel to manage the viewer's settings.
In the Gear menu, you can configure:
- Grid and axes – Toggle visibility and label settings.
- Legend and background – Control legend display and background color.
- Surface rendering – Enable/disable wireframes and adjust projection type.
Interaction with other viewers
The surface plot responds to data filters but row selection is limited. Clicking a data point in the surface plot highlights the corresponding row in the grid. However, selecting rows in the grid or other viewers does not modify the surface plot's display.
Viewer controls
| Action | Control |
|---|---|
| Select the row corresponding to a point | Click the point |
| Add a point to the selection | Shift+click the point |
| Toggle point selection | Ctrl+click the point |