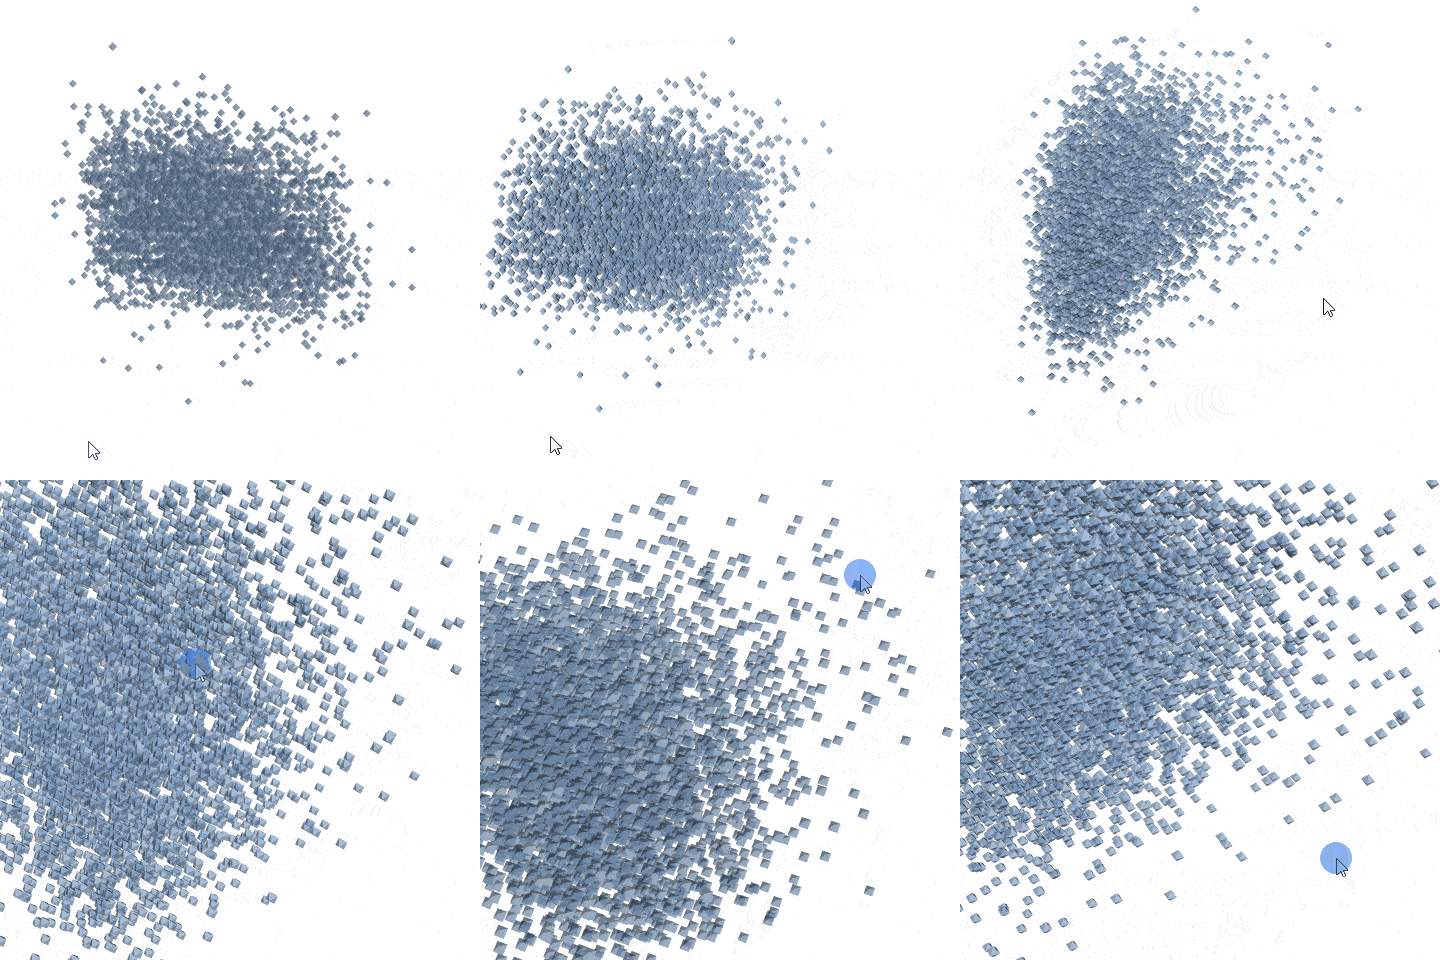
3D Scatter plot
Use 3D scatter plot to plot data points on three axes to show the relationship between three variables. Each row in the data table is represented by a marker whose position depends on its values in the columns set on the X, Y, and Z axes. Additionally, you can color-code and size-code points, as well as display labels next to markers.
Developers: To add the viewer from the console, use:
grok.shell.tv.addViewer('3DScatterplot');
Controls:
| Right click | Context menu |
| Mouse Wheel Up or Plus | Zoom in |
| Mouse Wheel Down or Minus | Zoom out |
| Click | Make current |

Videos
See also:
